
The term parity is familiar to any sports fan.
Defined by Google as “the state or condition of being equal,” parity in professional sports implies that the best teams in a league are not substantially better than the worst teams.
Prior academic research is flush with studies of how the four major North American sports leagues and divisions of professional soccer want, need, and strive for parity. Parity leads to less predictable outcomes and has been shown to increase game attendance and league revenues. Further, parity was the primary goal for the implementations of revenue sharing in Major League Baseball (MLB), the National Football League (NFL), the National Basketball Association (NBA), and the National Hockey League (NHL).
With salaries higher than ever, parity is a buzzword central to every league office. For example, recent stories covering MLB (in this ESPN story), the NFL (Washington Post), the NBA (New York Times) and the NHL (Bleacher Report) all claim that each of those sports show sufficiently high levels of parity.
“When you come into a season, every fan thinks that their football team has a chance to win the Super Bowl and that’s what I believe the 32 clubs are working towards,” said Roger Goodell, the NFL’s commissioner, in back in 2011.
But how do the league’s compare to one another with respect to parity? And in which league, as Goodell wishes for the NFL, are teams most likely to have a shot at winning the title? Lastly, what is the best way to go about measuring parity? These are just a few of the questions I’ll try to answer.
How to measure parity?
Most academic research considers the equality of teams within a given season as the central measurement of parity. One paper which provides a nice summary of how to compare the difference between good and the bad teams within a single season is by University of Lethbridge researcher Duane Rockerbie, and is linked here.
Rockerbie measured parity using relative standard deviation (RSD), where high RSD’s indicate higher variability within each league. The NHL (RSD of 1.606 in the 2000’s) and the NFL (RSD of 1.581), as measured by their lower RSD values, appear to be the professional league’s with the highest amount of parity in recent years. A table, featuring decade-by-decade RSD’s, is copied below.

Is there another way to measure parity?
While RSD is the standard for measuring parity in the economic literature, a downside of RSD is that it doesn’t account for year-to-year consistency among professional teams. For example, the Detroit (NHL) and New England (NFL) franchises almost always finished at the top of their respective league’s standings during the 2000’s. This indicates a lack of parity; teams aren’t equal if the same teams are almost always finishing near the top. However, RSD is measured only within a single season, and does not account for how teams vary, or stay the same, between one year and the next.
In fact, standings from one year to the next could finish the exact same in one league, but RSD wouldn’t pick up on that trend.
Okay, so how does one measure team performance across years?
I initially got started thinking about parity and year-to-year consistency when I saw this cool graph, created by Seth Kadish.
Seth compared winning percentages of teams between one season and the next on scatter plots, done for each of the four American major sports, and then plotted the change in winning percentages using a violin plot. Clearly, as shown in the graph, this suggests that the NFL is the league with the highest amount of parity, with the NBA not too far behind.
While I liked the idea of measuring one team’s correlation between one year and the next, a more standardized metric than winning percentage might be more informative. For example, while the NFL plays only 16 games a year, MLB baseball teams play 162. Comparing the winning percentage of an NFL team, where going 14-2 (winning percentage, 0.88) happens roughly once a season, to an MLB team, where going 142-20 (with the same winning percentage, 0.88) has never happened, doesn’t seem appropriate.
My metric: Standardized winning percentage
Using the past ten years of each league’s final standings (I used baseball-reference and similar sites to grab the data), I estimated each team’s standardized winning percentage (SWP), where SWP is a winning percentage minus 0.500, divided by the standard deviation of that league’s yearly winning percentages. In Stats 101, of course, this is just a z-score for each season in each league. For NHL teams, where teams can earn zero, one, or two points in a game based on performance, I used point-percentage instead of win percentage, as described on hockey-reference.com
Standardizing allows us to compare across league using the same scale. For example, the 2007 New England Patriots (SWP = 2.40), who finished 16-0, had roughly as improbable a season as the 2007 Dallas Mavericks (SWP = 2.39), who finished 67-15. Of course, those two teams play different sports, and they had much different winning percentages. However, because their winning percentages were standardized, I feel somewhat confident in saying that the Patriots and Mavericks seasons were equally probable (or improbable, if you will).
Next, I calculated the correlation between each season’s SWP and the prior season, which I’ll call the autocorrelation of SWP. Of course, we should expect mostly positive autocorrelations, since that as a team’s SWP from the prior season rises, its’ SWP in the current season also likely goes up. Here, lower autocorrelation of SWP will signify higher year to year parity.
Figure 1 shows the past 10 seasons for MLB, the NFL, the NBA, and the NHL, along with a smoothed line through each league’s points.

The NBA, with the highest year-to-year consistency, shows the lowest parity. Moreover, NBA teams’ performances from one year to the next appear to be growing more consistent in recent seasons. The NHL and MLB appear to show similar and moderate levels of consistency (autocorrelations near 0.50), while the NFL appears to show the highest amount of parity, as judged by autocorrelations near 0.
Sidenotes: Because the 2012-13 NHL season featured far fewer games due to a lockout (48 instead of 82), I made a special mark for this point, and left it out when producing the smoothed line. Future seasons will allow us to get a better sense of whether the low correlation between the 2011-12 and 2012-13 NHL seasons was a fluke or a sign of higher parity to come. Further, the NHL’s 2004-05 season was cancelled, so that league is missing a year.
So the NFL has parity and the NBA doesn’t, right?
Not so fast, my friends. While standardizing winning percentages allows us to compare across leagues, something still bothered me about comparing the NBA, NHL, and MLB to the NFL, due to the small sample size of games in professional football.
To more accurately gauge the impact of having only 16 games, I decided to simulate the results of other professional leagues if they were to also have 16-game schedules. To do this, I first made the assumption that the SWP of NBA teams (82 games in most seasons, 66 in 2011-12 due to a lockout), NHL teams (82 games in most seasons, 48 in 2012-13), and MLB teams (162 games) in each season was a true measurement of that team’s talent. This seems reasonable – tanking might hide a team’s true talent in the NBA, but I’ll ignore that here.
Taking each teams SWP in each season, I simulated 1000 draws of each season in each league, assuming that each team in each league played only 16 games. For example, with the Mavericks in 2007 (true winning percentage, 0.88, SWP = 2.40), this yielded 1000 simulated seasons of 16 games, nearly all of which produced either 14, 15, or 16 wins.
Next, I calculated the year-to-year autocorrelations at each draw in each league, as was originally produced in Figure 1. I extracted the 2.5th, 50th, and 97.5th percentiles of these autocorrelations across the simulations, done at each season. This will give a sense of the expected year-to-year consistency had each league’s season been 16 games.
Here are the results for each league (shown in black and grey), overlaid with the NFL’s smoothed year-to-year correlations from Figure 1 (shown in red).
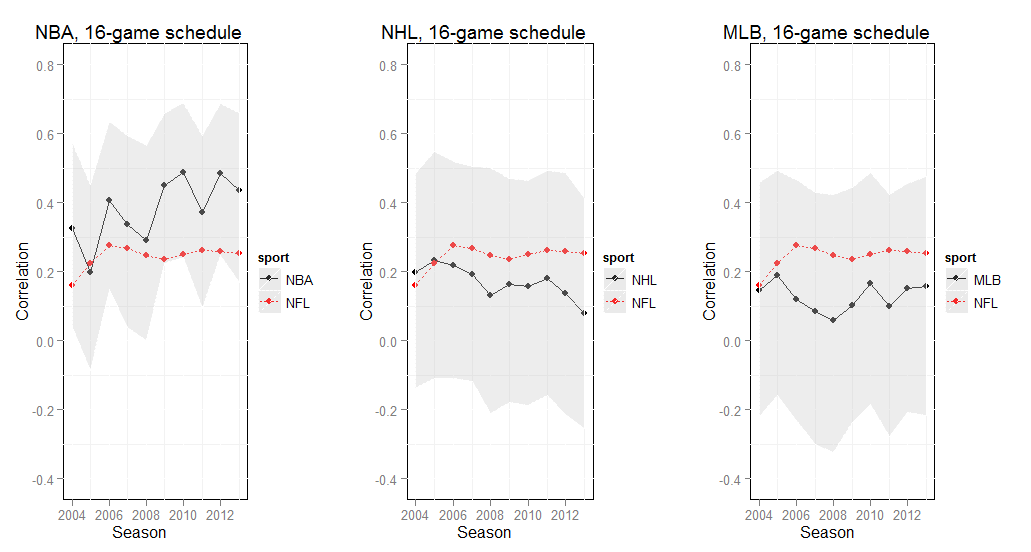
The results of the simulated 16-game seasons are quite interesting.
First, other than in 2013, the NBA and the NFL show relatively the same year-to-year positive consistency under a mythical NBA 16-game schedule. Meanwhile, both the NHL and MLB mostly show year-to-year correlations that hover just above from 0, and perhaps are negative, under a 16-game schedule. This suggests that, relative to the NBA and the NFL, the NHL and MLB show the least amount of year-to-year consistency, at least if they were to switch to an NFL team’s schedule.
So what does this mean?
Parity can take a few forms.
Within a season, the leagues with the lowest amount of separation between the haves and the have-nots appear to be the NFL and the NHL, as per RSD. Between seasons, the NFL shows the lowest amount of consistency, and the NBA the highest.
However, both of those results are artifacts of an NFL schedule which features a dramatically smaller sample size than the other sports. In our simulations, we accounted for this difference by mimicking the results which would have occurred had other sports also played schedules of only 16 games. The results of these simulations suggest that the NFL’s parity is as much a function of its number of games as anything else; under the same number of games, its the NHL and MLB which show the lowest year-to-year consistency.
In his paper, Rockerbie calls the NBA an ‘anomaly,’ with substantially lower levels of parity, relative to other sports. Here, we make the suggestion that were the NBA to adopt the NFL’s 16-game schedule, the year-to-year consistencies of teams in both leagues would be relatively similar.
So was Commissioner Goodell correct – does every NFL team have a shot each season? Perhaps. But that’s mostly because of the small sample size of games, and not because of the league’s parity.
