
During their 17 playoff wins in the Tom Brady-era, the Patriots recovered 28 out of a possible 48 fumbles (58%), while in their 7 postseason losses during that period, the team recovered just five of 20 (25%). Using these numbers, it appears that the team’s fumble recovery talents (like recovering all five fumbles in this win over San Diego), or lack thereof (including no fumble recoveries out of five opportunities in the two Super Bowl losses to the Giants) likely influenced these games’ outcomes.
But were the Patriots squads that lost simply less-skilled at recovering fumbles than the teams that won? Or were some of those teams just smitten by bad cases of fumble luck? Here, I’ll explore the topic of how fumble recovery percentage impacts NFL outcomes.
Before starting, however, it’s important to point to a few important existing pieces on the subject of NFL fumble recoveries and recovery rates. First and foremost, Football Outsiders deserves much of the credit for the term fumble luck, and writes “fumble recovery is a major reason why the general public overestimates or underestimates certain teams,” on their Basics webpage. Further, former Outsiders writer Bill Barnwell routinely cites fumble luck in his columns, including this one from 2012. Other writers have chipped in, too, including Chase Stuart, who explored the topic on the Football Perspective, using play-by-play analysis to show that fumble recovery percentages vary based on the position of the player who fumbled. Lastly, mgoblog replicated results similar to Stuart’s, using NCAA football data.
In this set of two posts, I build on the work of those mentioned above, taking a longitudinal approach. Specifically, I look at team’s fumble recovery percentages (FR %) over time, and the relationship of FR % with both winning and covering the Las Vegas Spread. Before starting, a quick but important thanks to Team Rankings for providing most of the data used here.
Can teams maintain an ability to recover fumbles?
To answer this question, I extracted each team’s FR % since 2003, and plotted each year-by-year FR % point in a scatter plot. For example, if a team recovered 54.3% of fumbles which hit the ground during its 2004 games and 45.2% such fumbles in 2005, this would appear on the plot as the point (0.543, 0.452). I also included a line of best fit (along with that line’s 95% confidence band).
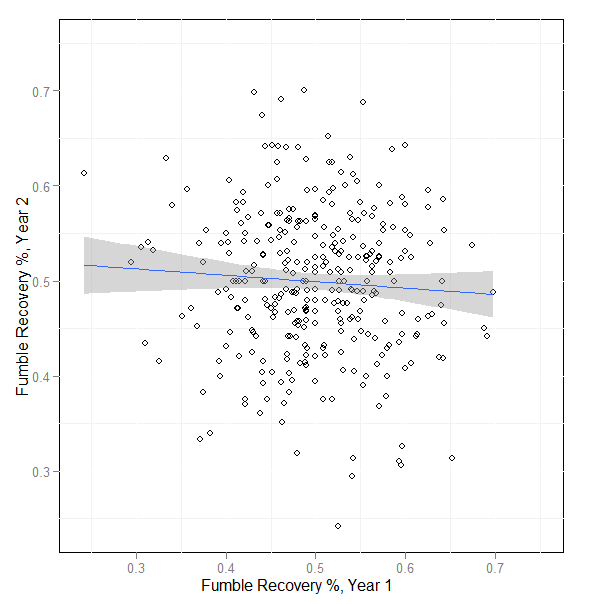
Overall, as judged by the even scatter and the horizontal line of best fit, a team’s FR % appears to be independent of its FR % from the prior year; it seems that on the whole, NFL teams cannot maintain any consistency with respect to recovering fumbles.
But what about certain defenses? Can the best defenses maintain a high fumble recovery percentage?
Here, it gets a little murky. Are the best defenses able to recover more fumbles? Or are they ranked as the best defenses because they luck their way into pouncing on the ball more often?
To get a better sense of team-by-team behavior over the past decade, I modeled both overall FR %, defensive FR %, and offensive FR % for each team, using random effects linear regression models, each of which included a random effect for each team. Here, defensive FR % is the proportion of fumbles recovered by each team’s defensive unit in each season. This metric, for example, will allow us to focus only on fumble recoveries that each team’s defensive units can control. Significant random effects will indicate that, indeed, specific units have been better or worse at recovering fumbles in this time period.
To save space, I won’t plot the random effects for either offensive FR % or overall FR %; in each of these models, all team-specific random effects were 0, indicating that, from one year to the next, a team’s FR % and offensive FR % is mostly random in our time period.
Below lies the plot of defensive FR %.
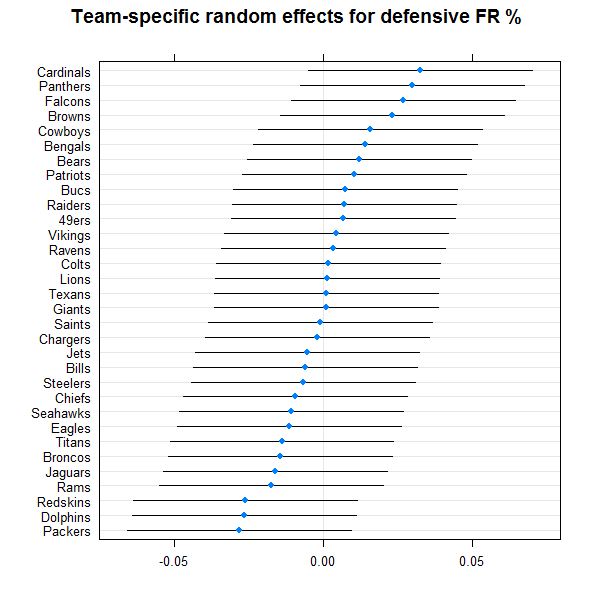
While there are some units with better than average (Chargers) or worse than average (Packers) defensive FR %, all of the confidence intervals for the team-specific random effects cross 0. As a result, it doesn’t appear that any defensive unit has been significantly better or worse at recovering fumbles since 2003.
Overall, while these results don’t completely rule out that a team or a unit could be really good at recovering fumbles, it appears fluctuations in fumble recovery percentages, at least on a season-to-season basis, are mostly due to chance.
So what’s it all mean?
Given the excellent work done by Stuart on fumble recovery rates by position, this isn’t to say that when one specific fumble hits the ground, each team always has a 50-50 chance at its recovery. For example, aborted snaps are more often than not recovered by the offense, and WR fumbles are most often scooped up by the defense (sadly, Stuart’s study doesn’t highlight butt-fumble recovery percentages).
However, given the information included here, it wouldn’t surprise me if most fumble types were also random over time, too; if there was a strong relationship between a team’s fumble types from one year to the next, we would expect to find some year-to-year correlation of defensive FR %, too.
In my next post, I’ll look at the effects of FR % on game outcomes, but within a season and in future seasons.
