

In the past few days, several outstanding MLB players have inked expensive contracts, with Robinson Cano, Jacoby Ellsbury, and Carlos Beltran all signing deals worth at least $15 million a year. One link each of these players have is that they have all won at least 1 Gold Glove, handed out annually to the best fielder at each position in baseball.
With defense likely an important part of the contract negotiation process, a friend of mind posed an important, but tough to answer question:
“Apart from catcher, what do you think is the most important defensive position in baseball?”
My initial answer was that the most important defensive positions in baseball had to be up the middle, including shortstop and centerfield, and that right field was the least important one. Admittedly, however, in forming these opinions, I was clouded by the fact that, as the worst fielder on any baseball, softball, or beer die team I ever played on, I was usually instructed to play away from where the object of choice would likely end up. In baseball, this meant eating up innings as the right fielder.
Anyways, lots of things probably go into determining an optimal answer to my friend’s question, many of which are tough to control for. For example, the right fielder at Fenway Park is much more important than the right fielder at Yankee Stadium, due to the different dimensions in each. Further, for teams that employ ground ball pitchers, it makes more sense to have strong infielders.
So while I’m not sure I can exactly answer the original question posed to me, I can provide answers to a related inquiry:
At what positions are players on certain baseball teams costing and saving their teams the most runs? And in other words, which position has the highest amount of variability?
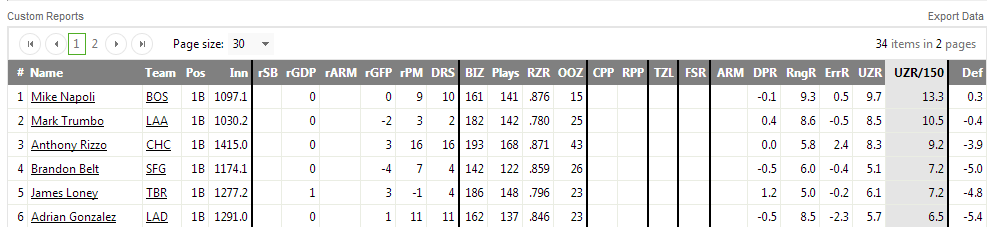
To answer this question, I chose Fan Graph’s Ultimate Zone Rating (UZR), which is a reflection of the number of runs a defender cost (or saved) his team during the season. According to Fan Graphs, 10 runs saved is equivalent to roughly one win. Thus, Mike Napoli, with a UZR of 9.7 (see the chart below), was one of the best defensive first baseman in baseball in 2013, helping the squad win an additional game with his defense along. Negative UZR’s, for some players, indicate the number of runs that the player cost his team with poor defense.
A few small notes. First, I chose 500 innings played as my minimum cutoff at each position, and, to compare players who played different amounts of time, I used UZR/150, which is a player’s UZR per 150 games played at that position.
Next, I went position by position (excluding catcher, for which UZR is not estimated), estimating the standard deviation across all players who met the innings cutoff. To compare multiple years, I also calculated each positions’ standard deviation for 2008 and 2003.
Standard deviation can roughly be explained as the average dispersion from the mean, and so high standard deviations will indicate that players at that position varied greatly across baseball players. Low standard deviations, thus, suggest that players’ defense talents at a certain position, as judged by UZR, were roughly equivalent.
Here’s the table with standard deviations by position by year, along with the averages across the three years I chose.
| Position | 2013 | 2008 | 2003 | Average |
| 1st Base | 8.50 | 9.57 | 9.28 | 9.12 |
| 2nd Base | 9.57 | 9.62 | 9.81 | 9.67 |
| 3rd Base | 15.15 | 9.72 | 12.53 | 12.47 |
| Shortstop | 12.24 | 10.21 | 8.01 | 10.14 |
| Left Field | 13.37 | 14.67 | 12.57 | 13.53 |
| Center Field | 16.50 | 13.13 | 13.09 | 14.24 |
| Right Field | 17.70 | 17.24 | 14.18 | 16.37 |
My comments:
First, outfielders seem to contribute, on the whole, more to a team’s success (or lack of success) than infielders. The average deviation from the mean for each outfield position is roughly a UZR of 15, while infielders, for the most part, lie within 10 runs of the mean UZR.
This doesn’t necessarily mean, of course that outfielders are better fielders; in some respects, it could indicate that because poor defensive players might be plugged into left field or right field, those choices have led to substantial variations in runs saved.
Second, differences in the defensive abilities of shortstop and third basemen appeared to have a larger impact on the game in 2013 than in 2003. While this could just be random fluctuations (and, as a metric, standard deviation is affected by outliers), it could also suggest that as home runs (and likely fly balls) have declined, the importance of strong defensive infielders has grown.
Lastly, for what its worth, I looked at some individual player UZR rankings. The best defensive player was Baltimore’s Manny Machado, who in 2013, posted a UZR of 31.2 at third base. Brad Hawpe, meanwhile, cost his team at least that many runs with a UZR of -36.1, playing right field for the 2008 Colorado Rockies.
Organizationally, I also compared the 2013 Red Sox with the 2003 edition. This past year’s squad featured five players near the top of their position lists (Shane Victorino, Ellsbury, Stephen Drew, Mike Napoli, and Dustin Pedroia), who combined to help the Sox win an estimated additional 6 games with their defense alone. In 2003, however, not one Red Sox player boasted a UZR above Trot Nixon’s 5.8, and six regulars posted UZR’s less than -5.1. Based on these numbers, its pretty clearly a shift in priorities has taken place on Yawkey Way.
