
Thursday’s NFL draft marks the culmination of several months — or perhaps years — of work.
The amount of preparation that team scouts and analysts put in is overwhelming. This includes sleeping at the office, 20-hour work days, and hours upon hours of poring over film and interviewing players and their coaches. With teams wanting to learn just about everything there is to know about a player, no stone is left unturned.
Additionally, the effort that teams place on evaluating players has grown leaps and bounds over the past half century. In the 1970s, for example, Washington famously went a decade without a first round pick. Given the differences between now and then, one would expect that at some level, teams can better draft players now than they could decades ago.
But have teams improved at drafting?
In this post, we’ll look into the evolution of NFL drafting ability over time, and compare it to other North American Leagues.
**************************************************
Our interest lies in the link between where a player was drafted (pick number) and how well he performs. No player-level metric is perfect, but Pro Football Reference’s career approximate value (CAV) provides a decent snapshot of a player’s talent. We’ll use that as our outcome.
Not surprisingly, the the distribution of CAV is strongly skewed right, with most players between 0 and 20 but a handful of stars rating above 100. Thus, we’ll prefer a non-parametric tool to a parametric one, as to avoid making assumptions about CAV’s underlying distribution.
One possibility would be to set a binary cutoffs, as Chase does here, to assess the percentage of a draft’s CAV that falls within a certain range of picks. Alternatively, as to maintain all of a draft’s information, rank correlations (Spearman, Kendall’s Tau) can help us assess the (hopefully monotonic) dependency between draft spot and performance while also maintaining all of a draft’s information as far as which players were ranked better.
Looking back, here are the yearly Spearman rank correlations between draft position and CAV, separated by round. Values of 1 would reflect a perfectly monotonic link between draft spot and performance, while values near 0 would reflect no link. The blue line reflects possible non-linear trends over time, with the grey area reflecting our uncertainty.
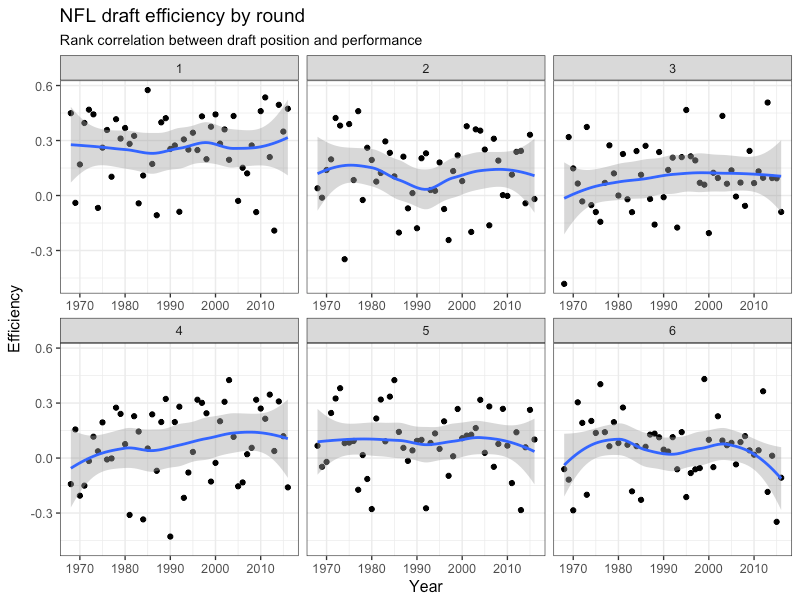
There’s no evidence that in any round, NFL teams are doing a better job at selecting the best players early. In 2013, for example, the 1st round rank correlation coefficient was about -0.2, indicating a year where picking earlier in the draft was linked to worse performance. Of the first 10 picks from that draft, only 1 has made a Pro Bowl, compared to five of the final ten selections.
Additionally, note that for rounds 4-6, there’s little evidence of a difference between rank correlation and 0, which suggests that by that point, there’s not a big benefit to picking earlier in the round.
We can also add a positional separation allows us to both assess if any changes over time identify with a specific type of player, and to account for the fact that if teams draft for positional need, that may supercede taking the best overall player available.
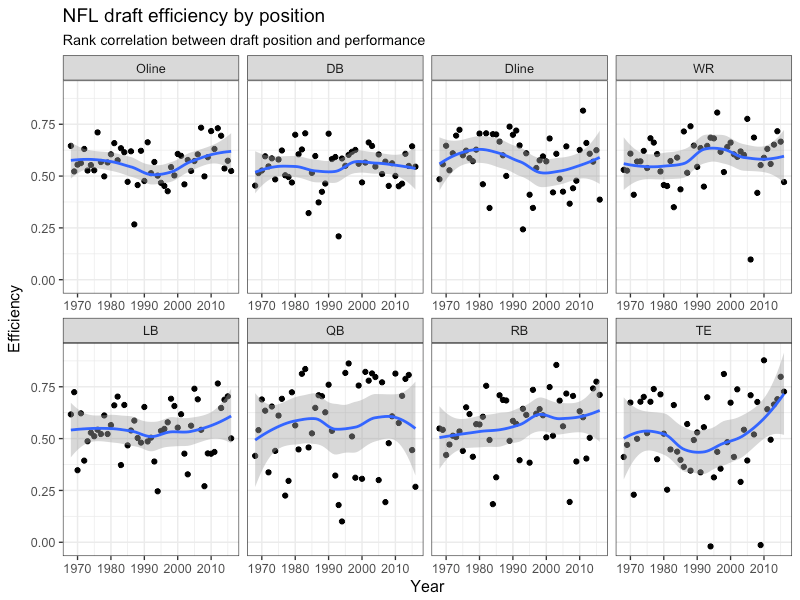
Per CAV, there’s been a *slight* improvement in the drafting of running backs and wide receivers, and, after a dip in the 1980’s, tight ends. The latter is potentially related to how teams may be more apt to draft receiving tight ends earlier in the draft, with less of an emphasis on blocking tight ends. Receiving tight ends may be easier to evaluate, for example, or may score higher on CAV.
For most positions, though, the link between positional CAV rank and draft position is as noisy as it was four decades ago. Interestingly, there does not appear to be any one specific position where teams are better at identifying talent.
Note that in using CAV, I was able to chart rank correlation’s all the way through the 2016 draft. However, if anything, this likely overestimates the recent link between draft position and performance – teams are more likely to give their earlier picks playing time in their first few years. Once lower drafted players have more time to establish themselves, we would expect the link between draft position and performance to lessen, which could lower the recent scores.
**************************************************
While it’s easy to pick at the the NFL’s inability to noticeably improve player evaluation over time, it’d be more telling if we could find that other professional leagues have gotten better over time.
Using the same metrics described here, I charted the link between pick number and player performance in MLB, the NBA, NFL, and NHL. I focused on each league’s first 60 choices (64 for the NFL), which matches the current length of the NBA draft.

A few things stand out.
First, the NBA bests all other leagues as far as an overall performance, which isn’t surprising given the steepness of its draft curve and the differences between the importance of the best players relative to the league average.
Second, over time, the link between performance and draft position has grown stronger in both MLB and the NHL. While improved drafting ability is one possibility in both sports, in MLB, changes to the draft structure may also be responsible. Specifically, big market teams are no longer allowed to award big bonuses to players later in rounds, which could have been pulling correlations closer to 0.
In the NBA, after an early possible spike, there doesn’t seem to be any improvement over time. However, given that the NBA is already starting with rank correlations closer to 1, there’s also less room for improvement.
Altogether, it’s certainly feasible that the NHL and MLB have gotten better at drafting, while the NBA may have already reached its peak. In the NFL, meanwhile, drafting ability has either reached its limited peak, or involves so much noise that it’s difficult to identify a substantial, league-wide improvement.
**************************************************
Postscripts:
-I dropped specialists in the NFL for the position level chart, given that so few are drafted each year.
-For those of you who gave Chase’s article a read, there was a tangible difference between using rank correlation (as I did above) and the traditional correlation coefficient (Pearson’s). With the latter, there does appear to be an improvement over time, potentially linked by a few outlying observations drafted early.
-There may be other reasons for the NHL’s apparent improvement over time besides an improvement in player evaluation, or it could be tied to my choice of player outcome (games played). Separating by rounds, the greatest efficiency improvement appeared to be in round 1.
-Code is available here. This includes the scraping code, so it could take a few minutes. Feel free to play around.

This is excellent, and I especially liked the sport-by-sport comparison. Do you have any data to examine whether draft success between teams (i.e., certain teams are more skillful at drafting) significantly differs from that expected by chance?
Thanks for reading! Haven’t done anything myself. It’s a difficult question to answer, but the data that I used would be a decent place to start.
I’ve been reading a bit about how to test it. From what I have seen (and hopefully understand, though I’m not knowledgeable enough to run it yet!) is that you can do a multilevel model that adds draft round as a predictor, but also includes team as a random factor. Then you can see whether including team as a random factor improves the model.