
Note: This is a guest post by Juho Jokinen.
Lately, there has been some discussion about choosing between the extra point kick and the 2-point conversion, as well as the criteria NFL coaches should use in different situations when deciding plays. The most common argument I read is “this play has more expected points so it’s better in a long run.” While expected points give us some information about the value of our choice, I’ll point out that we should try to compare how our choices affect win probability because that is the ultimate outcome.
So, lets play a game where we have two conversion options and they are the only way to score. For sake of simplicity, assume we have to choose before the game what conversion type we are going to use. At the end, we can compare which conversion strategy leads to more points more often.
Let’s say that the number of conversion attempts per game, n, is between 1 and 6, and that both teams will have same amount of conversion attempts per game. Here are the conversion options with known probabilities:
1-point: 94.5% = p1 , expected points –> 0.945
2-point: 47.5% = p2, expected points –> 0.95
n = conversion attempts per game {1,2,3,4,5,6}
Which one should teams use and why?
The easy answer is that based on expected points criteria, we should always choose the 2-point conversion, as 0.95 > 0.945.
But let’s see what happens when compare it to the lower expected points choice (the extra point) using a more technical approach.
Let X be a binomial random variable with parameters (n, p1 = 0.945), and let Y be a binomial random variable with parameters (n, p2 = 0.475). Our interest lies in the difference Z, where Z is a random variable Z= X-2Y. This reflects the difference in point totals scored between teams taking each strategy.
Now the expected value of Z is negative, which still indicates that 2-point conversion choice is better in expectation. However, we should be interested in the probability of Z being positive versus negative with different n values. In other words, because we are interested in predicting which team will win more often, we are more interested in P(Z > 0) and P(Z < 0).
As it turns out, whether or not a team should choose the 2-point conversion (e.g., whether or not P(Z > 0) > P(Z < 0)) actually varies by n.
For n = 1, the 1-point strategy wins, with the 1-point team winning 49.6% of the time, relative to 47.5% of the time for the 2-point team. At n = 2, however, it’s actually reversed, with the 2-point strategy being most preferential (27.9% versus 27.5%).
Here is chart comparing these two strategies with different n. The area in red depicts the winning percentage for a team always taking the 1-point strategy, green is the fraction of tie games, while blue is the winning percentage for the team taking the two-point strategy.
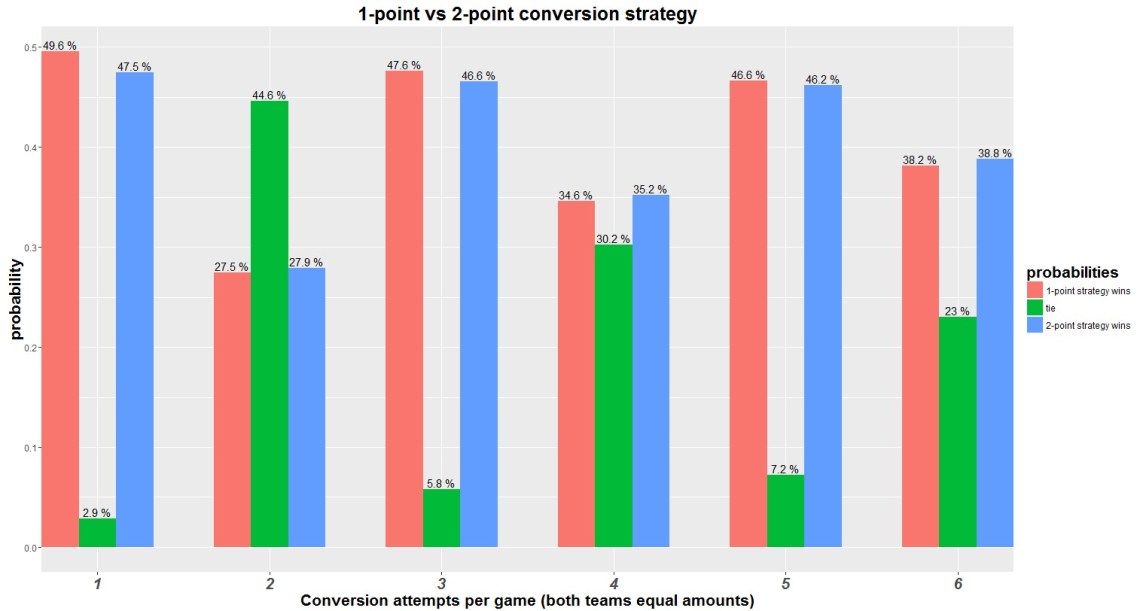
Indeed, the correct strategy actually depends on the number of conversion attempts we get per game. The 1-point teams wins out for n = 1, 3, and 5, while the 2-point team wins out for n = 2, 4, and 6.
Interestingly, if each of the expected values are identical, it turns out that 1-point strategy dominates all other strategies with these rules and assumptions. One might argue that I conveniently chose my numbers this way so that smallest expected points option would have highest win percentage, but my main point was to show having expected points edge does not lead automatically to more wins in a long run which some people seem to believe. And in reality, an extra point kick and 2-point conversion probably have very close expected points values and this is the way they should be compared if we knew the exact conversion probabilities, which of course we don’t know.
The conversion probabilities chosen above for 1-point and 2-point are actually fairly similar to the estimates that we have on extra point kick and 2-point conversion in NFL today, so i would argue that kicking that extra point is not so bad after all even with that slight expected points disadvantage it might have. But if the 2-point conversion rate starts to get closer to 50%, which for some teams it might already have, that becomes the better strategy.
Of course, it’s always easy to compare these things with exact numbers, but in reality there is a lot of uncertainty about these conversion rates and they depend on various factors which are hard to measure precisely. As Michael (Lopez) pointed out me, that uncertainty makes these strategies basically coin flips and that just emphasizes the importance of trying to choose the plays to maximize our win probability given the score state of the game. And we should always try to model how our choices affect win probability and not look just raw expected points, which might sometimes lead to wrong choices.
Michael also linked me this great article by Mark Taylor where this same concept is discussed in a concept of soccer xG-model and you can find it here:
http://thepowerofgoals.blogspot.fi/2014/02/twelve-shots-good-two-shots-better.html
Juho Jokinen is a former pro ice hockey player from Finland and current math/statistics student (BSc math and MSc statistics) in University of Oalu, Finland. This is his second season following the NFL, as football is a marginal sport in Finland. Follow him on Twitter @jokinen_juho.

This is a really enlightened take on this issue. So, odd number of scores –> 1 point better, even number of scores –> 2 points better, with the gap narrowing as you add more scores.
In non-statistical terms, I guess what you’re seeing is basically the ability to “make up ground” if you foul up your first 2-pt conversion attempt. There are also different scenarios where you come out ahead if scores are “paired” versus “unpaired.” So, yeah, moral of the story is consider the score state of the game!
This is similar to that puzzler Michael put out on Twitter a few weeks back about the Pats and Steelers where the Patriots were better off kicking the PAT vs. the Steelers going for two despite 2 points being a better idea in the long run!