
I told myself I was done with with Deflategate – and really, I was – that is, until I read this.
“Now I actually have some validation in the field,” Sharp said. “‘Hey, this guy was right all along.'”
Wait, what?
Forget the data twisting and statistical errors of the original analysis. The author claims to be vindicated by the fact that the Wells report found Patriots quarterback Tom Brady to be ‘more likely than not’ to have been involved with the deflation of footballs.
Okay then.*
*******
But despite my skepticism regarding Sharp’s analysis, two of the brightest minds in football analytics also taken the time to look at Patriots fumble rates, eventually concluding that the Patriots were indeed outliers.
First, after comparing Sharp’s critics to Nabisco running a study on snack cookies**, Brian Burke used multiple linear regression to model the number of fumbles in each NFL game since 2000, finding that the Pats posted much lower rates than the rest of the league in the years following 2007. Next, Benjamin Morris argued that the likelihood of team fumbling rates being at the Patriots levels or lower to be about 1 in 10,000. Linking low fumble rates and Deflategate findings, Morris writes that it “makes it more likely that the relationship between inflation levels and fumbling is real.”
One thing that Morris argues for – which I agree with – is that “there’s definitely more to be done on the Patriots fumbling to isolate for the fact that they were the most consistently winning team, the types of plays they ran.“
As Morris indicates, and what Burke hints at, is that modeling fumble rates is not straightforward, nor close to it. Because NFL teams aren’t randomized to run the same plays with the same time on the clock and from from the same spot on the field, any finding through this point has been evidence on the aggregate, averaged over games, plays, or perhaps a few in-game variables.
A play-by-play analysis, however, is missing.
And while it doesn’t ‘vindicate’ any particular finding, nor leave the Patriots free from suspicion, I found the task of looking at NFL play-by-play data to determine fumble rates quite interesting.
*******
I took the last 15 years of play-by-play data from Armchair Analysis (AA). All the code is linked here: the data costs $35, so I can’t provide that, unfortunately. However, if you have AA’s data, feel free to play around. Also, I’m going to focus on data from 2007 onwards. If you are interested in contrasting whether or notPatriots fumble rates changed substantially at any point over the last 15 years, I’d recommend a change-point analysis.
Let’s start with some descriptive statistics.
Point 1: Teams are less likely to fumble on QB kneel downs.
It’s easy one to begin with.
In fact, you are probably laughing right now, and you should be. There have been 5284 NFL kneel-downs since 2000, and not a single one resulted in a fumble using AA’s data. So who cares?
Here’s a plot of the teams who have taken the most kneel downs since 2007.
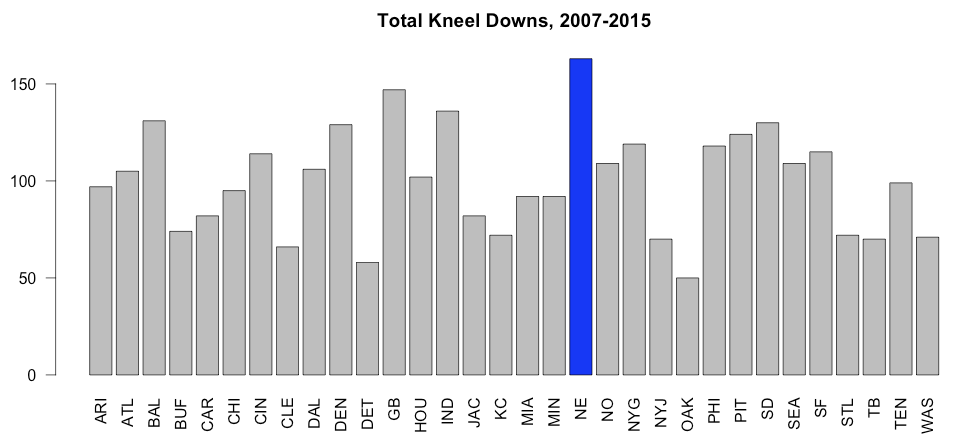
More than 25 snaps ahead the second place team, the Patriots have the most kneel downs.
Mentioning kneel downs seems silly, but this matters. Including kneel downs in an analysis of fumbles per play inflates the denominator (number of total plays) among teams more likely to be taking a knee, as the Patriots apparently were. In fact, the correlation between fumbles per play and kneel downs is -0.6. Here’s the relationship between the two variables. Teams with lower fumble rates tend to take more kneel downs (for one of several reasons).
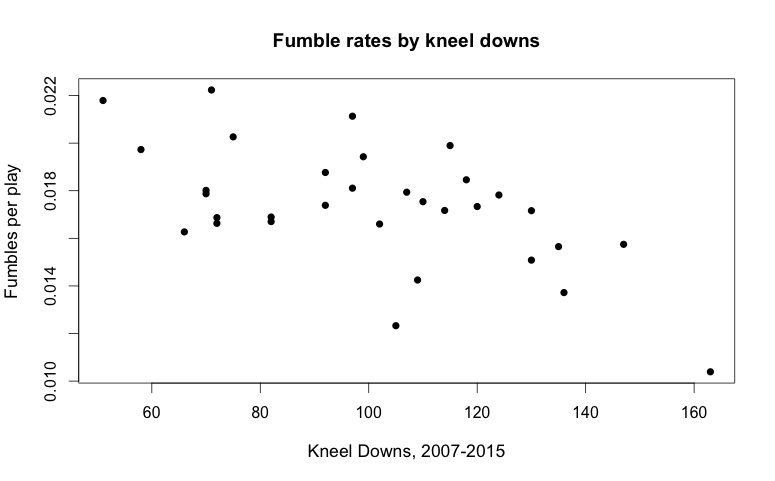
After making the graph above, I deleted these plays. I also deleted QB spikes (Patriots had more of these than the average team) and any pass that was intercepted (Patriots had fewer than average). It’s hard for the offensive team to fumble on these plays. It’s even harder to fumble on kneel downs.
Point 2: Teams are less likely to fumble when they have the lead.
This was a bit surprising to me. For the regression model, I characterized each play based on the possession lead (3+, 2+, 1+, 0, 1-, 2-, or 3-) of the team with the ball. For example, an offensive team leading by more than 16 points would be up by three or more possessions.
Like kneel downs, scoring differential matters. Teams with the ball up by three possessions or more fumble more than 20% less often than other teams with the ball. So let’s see which teams have run the most offensive plays while up by three touchdowns.
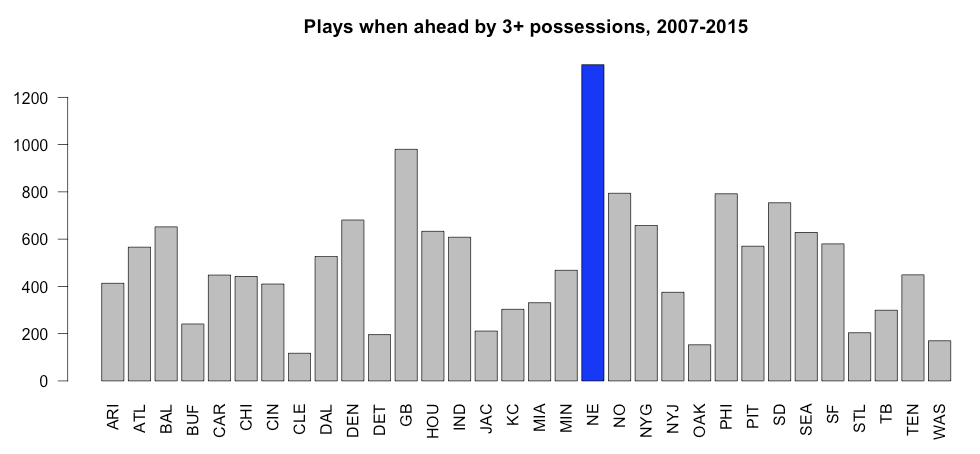
Again, the Patriots show up, with nearly three times the median number of plays when holding a three possession lead. Again, this matters. To generally contrast New England’s fumble rates with Cleveland’s, when the Patriots have run more than 11x as many plays with a 3+ possession lead as the Browns, is silly. Teams fumble with the ball less when they are leading on the scoreboard.
Point 3: Yard line matters
Given the tighter window with which to run a successful play, it stands to hold that teams would fumble less on plays close to their opponents end zone. So, similar to points 1 and 2, any aggregated analysis of fumble rates could abnormally penalize teams that run a disproportionate number of plays in this area. Here’s the number of goal-to-go plays for each team since 2007.
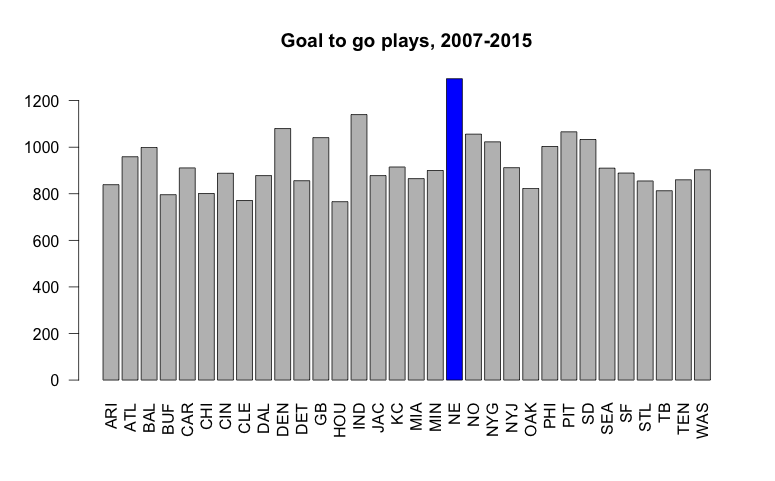
The Patriots have run nearly 200 more goal-to-go plays than any other NFL team since 2007.
*******
Hopefully we can agree that not all plays are created equal. So how can we account for all of these factors?
Using hierarchical generalized linear mixed models (GLMM) of binary data via the lme4 package in R, I modeled the log-odds of a fumble occurring (Fumble = Yes/No) as a function of several play and game specific factors that are conceivably associated with fumble likelihood.
A hierarchical mixed model is advantageous for a few reasons. First, we can account for game conditions (such as the weather), play conditions (like down, distance, and yard line) and play characteristics (run left or pass deep right, for example) that may dictate fumble rates. Next, instead of model with several dozen fixed effects for each team’s offense and defense, we’ll use random intercepts for both the offensive and defensive units. Of particular interest will be the random intercept for New England; if this intercept is extremely low, it would provide evidence that after accounting for all the game and play specific variables, the Patriots fumble rate remains mysteriously lower than other teams. We can also test the significance of the random intercept for each team – if it is variance term is significantly different from 0, it would provide evidence that there remains substantial variation in the fumble rates driven by the team with the ball or the team on defense.
Please note that some of these results mirror a live-tweet version of the model that I ran in late January, but please check out the R code for how I decided to syphon things like down & distance, etc. These decisions were not easy, but were made with the intent of identifying what characteristics of each play might determine fumble outcomes. Here are the fixed effects included in the GLMM:
Score, Play direction, Final Minutes (Y/N), Playoffs (Y/N), Weather/Surface, Goal to Go (Y/N), Home team on Offense (Y/N), Goal to Go (Y/N), Down/Distance, No huddle (Y/N), Shotgun (Y/N), over/under, and spread.
And here are the random intercepts***:
Offensive Unit, Defensive Unit
And here’s the code. Model results are here:
fit.rush<-glmer(Fumble10~Score+playcall+FinalMins+Playoffs+Weather+GoaltoGo+OffHome+
 DownDistance+sg+nh+ou2+spread+(1|off)+(1|def),data=filter(pbp,type=="RUSH"),
 control=glmerControl(optCtrl=list(maxfun=300)),
 verbose=TRUE,family=binomial())
summary(fit.rush)

fit.pass<-glmer(Fumble10~Score+playcall+FinalMins+Playoffs+Weather+GoaltoGo+OffHome+
 DownDistance+sg+nh+ou2+spread+(1|off)+(1|def)
 ,data=filter(pbp,type=="PASS"),control=glmerControl(optCtrl=list(maxfun=300)),
 verbose=TRUE,family=binomial())
summary(fit.pass)
*******
The first thing we’ll look at is a plot of random effects for each of the GLMM fits. On the left is passing plays, on the right, running plays.
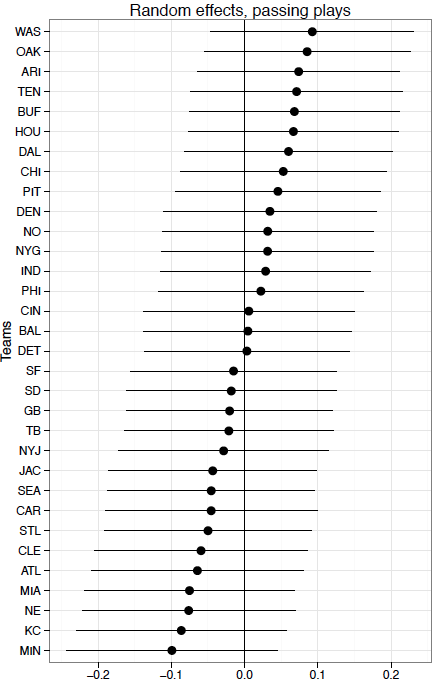
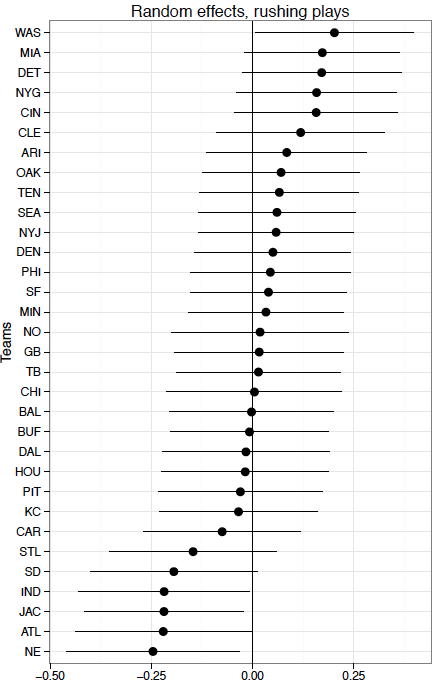
Once you account for play and game characteristics, it is really difficult to distinguish between the fumble rates of NFL teams.
In looking at passing plays, the random intercept terms for each offensive team are not significant predictors of fumble rates. The Patriots ranked as third in terms of teams least likely to fumble, given our model’s parameters. No teams intercept is noticeably different from 0.
There’s slightly more descriptive ability in using random intercepts with rushing plays. The Patriots’ intercept lies the furthest from 0, but it is not noticeably different from teams like Indy, Jacksonville, and Atlanta, which also boast significantly lower rates of fumbling on running plays.
Interestingly, Washington has the highest intercept on both rushes and passes.****
*******
If you are still reading, it is greatly appreciated. Mixed models have been used in awesome ways to answer really good questions in sports (see catcher framing and deserved run average for recent examples).***** This is not one such awesome application.
However, we learn in Introduction to Statistics that two variables are often associated for reasons beyond a causal mechanism. Given the results here, it seems safe to say that part of the link between the Patriots and low fumble rates was driven by game and play-specific conditions that those two variables were also associated with. Further, its easy to forget about funny data quirks in nearly all applied work, as we noticed with kneel downs and spikes in the football play by play data.
*******
Footnotes:
*There are a few other issues to consider. First, the Wells report also proposed that the Patriots started purposely deflating footballs in mid-2014. So, any lower fumble rates prior to this would have been, in relative terms, within league rules. Further, there’s also the issue of whether or not the Patriots ‘deflater’ travelled with the team, which unfortunately goes against the author’s inclusion of all games simultaneously. I can’t believe I just wrote the word ‘deflater.’
**This comparison seems ironic looking back, given that the NFL hired Exponent for its Wells report. Exponent was once was paid to argue that secondhand smoke did not cause cancer, among other suspicious claims.
***You may be asking yourself if we should be including effects (intercepts) for each running back. This is a fair question; if we include running backs as intercepts in the model, all team intercepts go to essentially 0. Given the RB’s are not randomized to carries, any team that purposely avoids playing running backs with high fumble rates would be penalized in our current fitting strategy.
****As a final step, I looked the significance of the random intercepts, given that from a model building standpoint, it’s generally preferred to use a model as parsimonious as possible. Including the random intercepts for both the offensive and defensive units significantly improves the model of fumbles on running plays, as judged by comparing the BIC of models with each random intercept to those without. On passing plays, the intercepts should be dropped from the model; there’s no evidence that, after accounting for game and play-specific covariates, teams’ fumbling rates differ from one another on passes.
*****A Bayesian strategy is also easy to implement. My guess is that a prior on team by team intercepts would only work to drag each team closer to 0.
*******
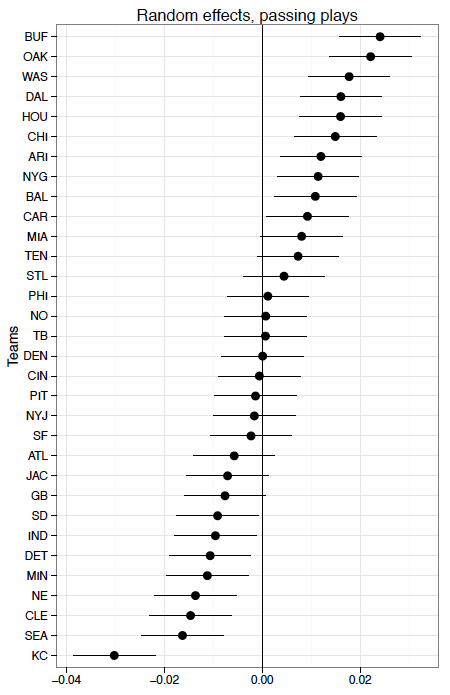
UPDATE: Scott from Football Outsiders requested that I include year effects as opposed to aggregating data across every season. I nested intercepts for each year within each team; this would account for seasonal trends for each unit, incorporated within some larger team effect. The yearly effects were indeed significant, both for offensive and defensive units.
Here’s the plot of the random intercepts for each team, after accounting for seasonal trends.


Reblogged this on Stats in the Wild and commented:
The Patriots aren’t that much better at not fumbling than other NFL teams. The Patriots also probably cheated. Totally different things.
It’s too bad the average fan will never get exposure / understand how statistics really work and compare apples to apples rather than just throwing misguided numbers out there – thanks for all the work and interesting read! -From a fellow data enthusiast and Pats fan #NoBradyNoBanner
Can you explain what a random intercept is in this kind of statistical model? I am really interested, but just don’t have the statistics vocab to understand what these plots are showing.
Hi Paul,
Sorry for being unclear – I wasn’t anticipating so many people reading this!
So most regression models have an intercept, which, in our case, can generalize as a starting point for the likelihood of a team fumbling on a given play, given its down, distance, score, etc. The model fit here has team specific intercepts, which represent how far above or below the league average each team is as far as fumbling goes. In this instance, the Patriots intercept is negative, which means they fumble less than the league average team, after adjusting for the game and play conditions. However, it does not appear that they are substantially different than the league average (0) or when compared to other teams (like Atlanta).
Does that help?
Thanks!
Mike
What’s worse is, the original “analysis” posited by that hack writer used one control, and it was a faulty control at that – eliminating any game played in a dome, as though fumbles never happened in domed stadiums.
Right. And I liked how it was eventually shown that the dome teams fumbled more at home than on the road!
Ok thanks for the explanation. It helps a little. I have some comments that I am interested in hearing you address (I probably still don’t understand this so don’t get angry please): It seems like you have taken a stat that has no error bars (fumbles) and in an attempt to correct for other effects like down, distance, score, you have added a substantial amount of uncertainty. Since each of these effects (down, distance, score) have only rough correlations with fumble rate, there is a lot of uncertainty. So in the end it looks like the corrections just scrambled stuff up rather than providing any clarification.
I really do like the point though that the Patriots participated in a greater number of plays with lower fumble likelihood than everyone else. That certainly has to have an effect. Unfortunately it is not clear to me that this effect is significant. Also you fail to mention in your piece that yardline has an effect on fumble rate — I assume it does like score, but you don’t indicate the stats that show that it does (it reads like you are just assuming it does).
Finally regarding kneel downs and fumble rate — it is possible that having more kneel downs is a direct result of a low fumble rate (you win more with less fumbles, therefore you would have more kneel downs). This argument can also be made for the score as well.
The biggest thing that is compelling to me is that the Pats fumble rate changed in 2007. The Patriots were great before that and after that, so I wouldn’t imagine that factors like you discuss here would have that much of an impact or would cause a substantial shift in the fumble rate because there is no reason why these things would change between 2002 and 2014. However, there is a clear event that happened in 2007.
I am also interested in Atlanta’s fumble rate (which is really low in all of these analyses) and wonder if they also are using deflated balls (perhaps not illegally deflated, but near the limit?) Could Matt Ryan like a flat ball as well? Perhaps they would be a better team to analyze since everyone is so emotional about New England.
Hi Paul,
You bring up some really good points. Let me go in order:
1- So fumbles don’t have any error to them, but looking at total fumbles is silly because some teams run more plays than others. Once we go to fumbles per play, it becomes a proportion. And the reason we need to associate error terms with these proportions is in order to distinguish a team with 1 fumble in 100 plays from a team with 100 fumbles in 10,000 plays. Both have the same fumble rate, but we can be much more confident that the team with 10,000 plays has reached its true rate.
2 – I included plays run in the ten yards closest to the goal-line, given that I know teams vary their personnel at that point. I didn’t explain the results in the write-up, but on the results page (https://github.com/statsbylopez/NFL_Fumbles/blob/master/ModelResults.R), teams passing the ball in this area have much fewer fumbles (the estimated coefficient is -0.43) compared to teams passing elsewhere on the field. It doesn’t look like running play fumbles differed in this area, though. I could have also probably used terms for other spots on the field, but I was trying to keep things relatively simple.
3- So obviously kneel downs come from teams that win, which come from teams that don’t fumble. But by getting rid of kneel downs, we are getting rid of wasted plays in the denominator of fumbles per play. And in accounting for score in the regression model, we are then contrasting differences in each teams fumble rates within each score, and then aggregating across score differences.
4 – A few people have asked about the 2007 thing. Among other changes, the Patriots ran more than twice as many plays in shotgun formation post 2007 than beforehand. They also played with the lead more. You may be interested in an exchanged I had over twitter:
From my perspective, comparing rates over time takes some additional care than anything that’s currently been done.
5 – I’m hoping to never have to analyze fumbles again. But by the same token that you worry about Atlanta, I’d look at Washington’s really high rates and wonder if something’s wrong with their ball 🙂
Your wisest sentence: ” Further, its easy to forget about funny data quirks in nearly all applied work, as we noticed with kneel downs and spikes in the football play by play data.”
I followed along until I read the footnotes.
Your footnotes left me back to square one:
*There are a few other issues to consider. First, the Wells report also proposed that the Patriots started purposely deflating footballs in mid-2014. So, any lower fumble rates prior to this would have been, in relative terms, within league rules. Further, there’s also the issue of whether or not the Patriots ‘deflater’ travelled with the team, which unfortunately goes against the author’s inclusion of all games simultaneously. I can’t believe I just wrote the word ‘deflater.’
**This comparison seems ironic looking back, given that the NFL hired Exponent for its Wells report. Exponent was once was paid to argue that secondhand smoke did not cause cancer, among other suspicious claims.
WHY do these give me pause? In the second footnote you implied that the research firm is suspicious or perhaps not trustworthy. It doesn’t necessarily matter who has or has not hired a firm in the past. It’s kind of like saying that ad agency hired to do advertising for Marlboro could never provide good advertising for Gillette. Sadly, then I go back to the first point, which implies that the report is completely factual in “proposing” that the Pats started this practice ONLY in 2014. Unfortunately, this leads me to question the degree to which you placed value on play types and field position. It appears that in some cases you applied a value while in others you may have removed some of the data entirely (kneel downs)? I am hoping that you first verified that NO fumbles occurred on any team during kneel downs. If not, then you’ve removed something that does contain a value (nonetheless small).
I do still believe that the Patriots are cheaters, and not just because of ballghazi, but because of their history and watching how they play the game. Even when they apply gamesmanship, they do so as trickery and finding backdoors or wrinkles in the rules. That alone makes me question if they are breaking the rules, but in a way that is less detectable. I think it’s safe to say that they are and will continue to do so until they get caught again.
Hi blackgold,
Thanks for reading. I am glad I had at least one wise sentence!
So the second footnote was mostly put in because of some personal attacks that had been made against this writer. I don’t care very much about Exponent or it’s role in this study, but others have pointed out that they may not have the best reputation among consulting companies. For some strange reason, I was also accused of this in previous writing.
I tried to remove any play where the offense had a near 0 probability of fumbling. The first two that stood out were kneeldowns and spikes – indeed, there were no fumbles on these plays (at least in Armchair Analysis data, which claims accuracy of more than 99%). I sort of regret taking interceptions out, too, given that teams did occasionally fumble on these plays (mostly fumbled snaps). However, the Patriots throw far fewer interceptions than average, so, if anything,putting INT’s back in would make New England appear more average.
My main conclusion is that the people that linked Patriots cheating with low fumble rates made the mistake that several researchers (including myself at times, for sure) made, which is to not look deeper into the data to identify other driving forces behind two variables being associated. If there was a fumbling benefit of deflating footballs, its a tiny, tiny effect.
As for cheating, incentives in professional sports are so strong that I’d argue that every team does it, and its sort of hard to blame them. The rewards far outweigh the risk. The Patriots do appear to lie in the upper percentiles of rule breakers, that’s for sure.
Thanks for the detailed reply. Interesting stats especially the fact that Brady’s fumble rate improved dramatically. I wasn’t clear what point you were trying to make other than that Brady’s improvement in fumbles on passing plays was similar to other teams. I think an interesting thing here is that there are probably other teams playing with softer footballs over different periods of time, but it would all depend on whatever their particular qb liked. Anyhow I wish I was more convinced by your model!