
We’re back again to judge preseason predictions, this time looking at NBA prognosticators. Our outcome of interest is the number of wins for each NBA team, and we’ll compare predictions to the totals set by sportsbooks in late October.
Despite my best efforts on social media, I could only find three competitors: Team Rankings, the Basketball Distribution, and Seth Burn. I also merged the predictions from those three sites, in what I’ll call the statheads Aggregate.
Our first criterion is Mean Absolute Error (MAE), which represents the average deviation between the predicted win total from each site and the observed total. In addition to the prediction sites, I also calculated the MAE using last year’s win totals, as well as 41’s, which represents a prediction of every team finishing 41-41.
For the 2014-15 season, statheads reigned supreme.
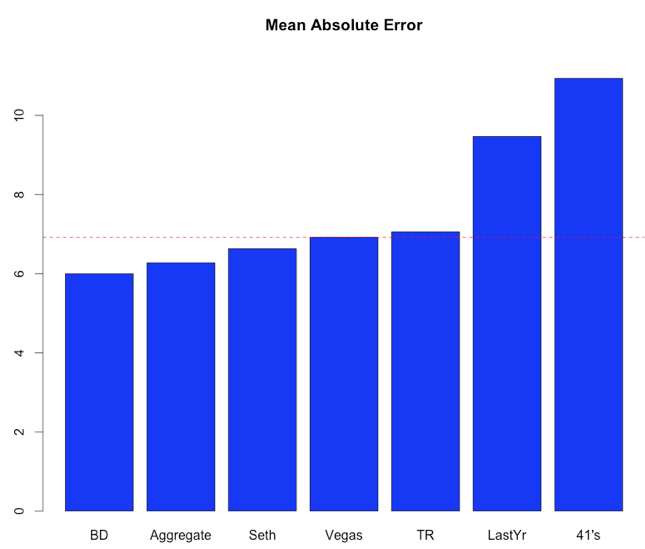
The Basketball Distribution and the aggregated picks from the three sites were both noticeably better than the totals set by sportsbooks. This matched results from last year for the Basketball Distribution. (Note: Nathan from the Basketball Distribution sent along a table with similar results to these).
Of course, its easy to assume that these results could be due to chance. To check this, I simulated 1000 seasons by using the sportsbook totals as the true mean team totals (slightly scaled, to account for the fact that the sportsbook totals add up to 41.5 wins per team), while also assuming that the 2014-15 season standard deviation of 9.3 marks the actual standard deviation of win totals. Here’s a plot of the simulated MAE for both Basketball Distribution and the Aggregate picks.
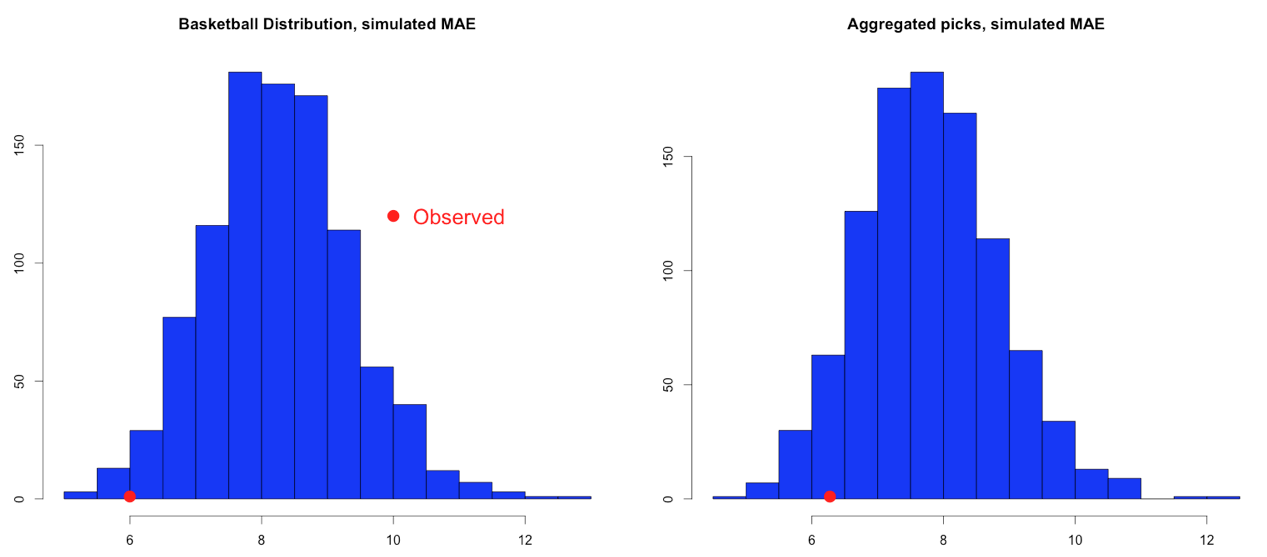
In only about 1% of simulations was the MAE for Basketball Distribution lower than the observed total. That’s a pretty solid effort. The aggregated picks from the three sites finished in about the 4th percentile, another solid effort.
And while it was a good year for the statheads, it wasn’t quite that for the Knicks. At 17 wins, New York finished more than 20 wins below its expected total of 40.5.
Here’s a team by team play of observed and predicted totals, arranged in order of projected total (the V). The calculator image refers to the stathead projection.

