
At the beginning of the year, we looked at how different projection systems viewed the 2013-14 NBA season. To recap, here were the key take home points:
Overvalued (projected to do worse than Las Vegas expectations): New York, Golden State, Brooklyn, Indiana, LA Clippers, Miami
Undervalued (projected to do better than Las Vegas expectations): Philadelphia, Milwaukee, Utah, Atlanta
All told, those 10 picks finished 6-3-1!
Good work, analytics people.
In this post, I’ll explore a few more details of the 2013-14 NBA season.
1) Which teams over and under-performed the most?
Here’s a plot of the observed and expected 2013-14 NBA season wins. For the expected, I used the season’s projections from sportsbetting.ag, posted in mid-October.
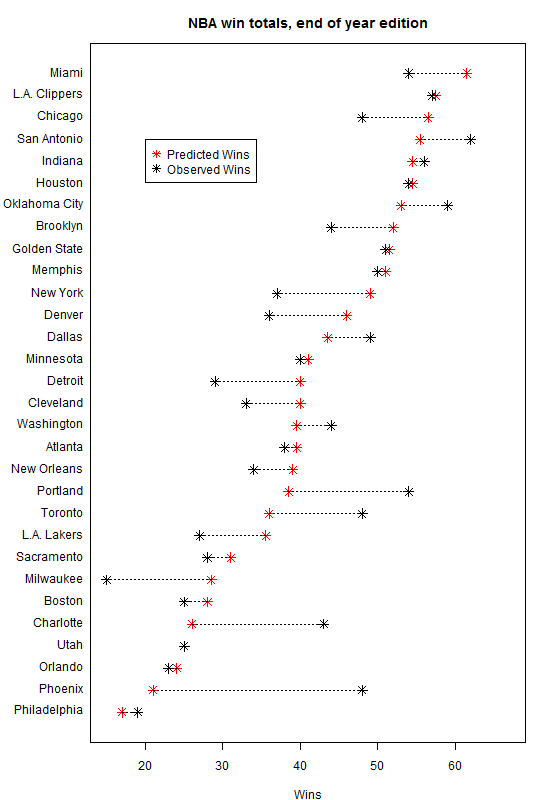
Phoenix, Toronto, and Portland all exceeded expectations by at least 10 wins, while Milwaukee, Detroit, and New York were the most disappointing teams, at least relative to preseason Vegas projections.
2) Which projection systems did the best?
Here, I’ll use projections from Team Rankings (TR), Schoene (ESPN), Prediction Machine (PR), Box Score Geeks (BSG), and the Basketball Distribution (BD).
To start, I calculated the average absolute error (i.e., the absolute difference between the projection and the observed wins, averaged across team), and the root MSE (i.e, the averaged squared difference), for each of our six systems, along with the Las Vegas line. These metrics give us a sense of how well each projection method did on the whole.
Of course, the record (wins-losses- ties) of each projection system, relative to the Las Vegas line, is another important metric. I used all 30 teams’ projections (labeled as “Record, overall”), as well as their top-10 and top-5 picks, which was judged by the difference between team projections and the Vegas line. For example, Team Rankings went 4-1 with its top-5 picks, hitting the unders on Brooklyn and Houston, the overs on Charlotte and Brooklyn, while missing in taking the over on Boston. Those were the only five picks in which TR deviated from the Vegas spread by more than three wins.
Here’s a table with the results (yellow highlights the optimal system, given each metric). 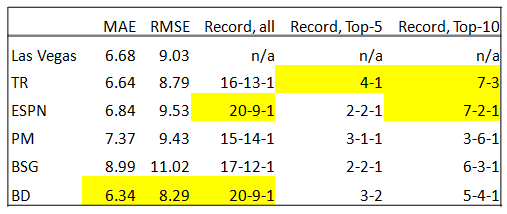
On the whole, Basketball Distribution had the best projections, at least with respect to MAE, RMSE, and overall record. Incidentally, BD’s top-picks didn’t fare as well; Team Rankings’ top-5 and top-10 picks appeared to be the most useful as far as isolating the best bets for 2013-14. On the whole, ESPN’s Schoene projection system did pretty well, too – and, even better, that system nailed the Knicks record, much to Carmelo Anthony’s dismay.
A few random notes before concluding. First, the projected Las Vegas wins were drawn from one website and on one day; it’s of course better to shop around for lines, as different places might offer better value on certain teams. Second, you may have noticed that there was one team which split: that’s Utah, whose 25 wins perfectly matched the preseason Vegas line.
All together, a pretty solid NBA season for the projection systems. This comes on top of a decent 2013 NFL season, and a mediocre 2013 MLB season.
Thanks for reading, and we’ll see you NBA projectors again in the Fall.

2 Comments