
Over on Stats Bomb, Seth Burn has taken FiveThirtyEight’s World Cup predictions, and, using what’s called the Kelly formula, placed wagers on each game accordingly.
Through the 24 games, Seth’s approach – via 538’s numbers – has taken an initial (and mythical) $100K payroll and turned it into about $500K.
While this approach has been profitable, not everyone is convinced.
To get a sense of how much 538’s success has been simply due to the small sample size, I decided simulate game outcomes thus far, through 24 games. Throughout, I used the bet-specific probabilities associated with Seth’s lines. As an example, Seth recommended Costa Rica on a wager of about $108K to win about $198K, at a line of +0.5 goals. Such a recommendation implied that 538’s model had Costa Rica with better than a 35.5% chance to cover the game’s 0.5 goal spread (Italy, of course, was favored). With Costa Rica winning, this was a successful bet for Seth, and for 538’s numbers.
Because not everyone is familiar with the Kelly method of gambling (including, for example, myself), I also assumed a one unit bet on each game. For example, a 1 unit bet on Costa Rica (+0.5 goals) paid 1.82 units. I simulated the set of 24 games 5,000 times, calculating the profit at each one. The R-code for the simulation is shown at the bottom (I entered the game probabilities and outcomes manually).
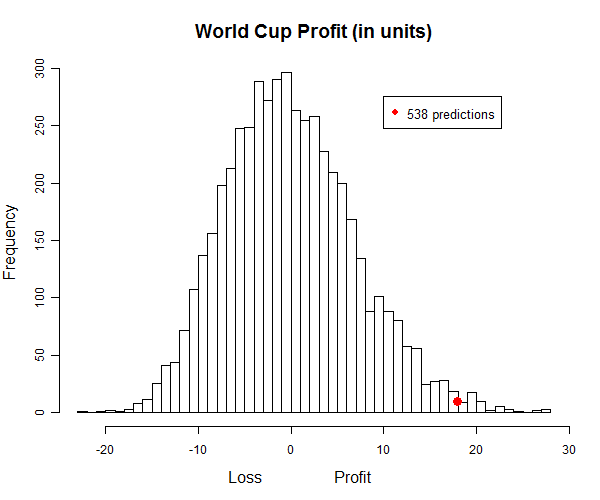
Here’s a histogram of the unit loss (or profit) in 5,000 simulations of the wagers that Seth placed on the 24 games. 538’s observed profit (17.97 units) finished in the top 1.1% of all simulated outcomes. Like any statistic we observe, the profit from 538’s model could be due to chance. On average, however, we’d only expect about 1 in 100 random sets of 24 games to produce a result more successful than 17.97 units.
A few comments:
-Like I mentioned above, I used a 1-unit bet for each game, both because it was easier to code and because it reflected how an average reader of Silver might place wagers. With his picks, Seth has varied the amount he has recommended. I’d be interested to see a related simulation with different bets, but that’s for another day.
-I’m pretty sure that inverting the game probabilities from Seth’s posts actually underestimates the success of 538’s model. This is because when a sports-book posts a team as a 3:1 underdog, the implied true probability is actually less than 25% (the sports-book needs to make money, after all).
-Here’s the R-code
probs<-c(0.355, 0.486, 0.520, 0.588, 0.187,
.370, 0.385,.284,.742,0.474,
0.600,0.507,0.490,0.280,0.248,
0.282,0.379,0.342,0.102,0.530,
0.253,.172,0.668,0.747)

outcomes<-c(1,1,1,1,0,
1,0,0,0,1,
1,1,1,0,0,
0,1,0,1,1,
0,1,1,1)

mean(outcomes)
n<-length(probs)

mat<-data.frame(probs,outcomes)
mat$net<--1
mat[mat$outcomes==1,]$net<-1/mat[mat$outcomes==1,]$probs-1
colSums(mat)[3]
#Observed net 17.969

B<-5000
Output<-matrix(nrow=B,ncol=1)
for (i in 1:B){
mat1<-mat
mat1$SimOut<-rbinom(nrow(mat1),1,mat1$probs)
mat1$netsim<--1
mat1[mat1$SimOut==1,]$netsim<-1/mat1[mat1$SimOut==1,]$probs-1
Output[i,1]<- sum(mat1$netsim)
}
Output

png("Posts/NS.png",height=500,width=600)
hist(Output,breaks=40,cex.lab=1.3,cex.main=1.6,
main="World Cup Profit (in units)",
xlab="Loss Profit ")
points(colSums(mat)[3],10,pch=16,col="red",cex=1.6)
legend(10,275,"538 predictions",pch=16,cex=1.1,col="red")
dev.off()
mean(Output>colSums(mat)[3])

2 Comments