
As part of their final assignment in my statistics and sports class, students were tasked with looking at the home advantage in the English Premier League (EPL). In some recent and related work, James Curley and Oliver Roeder found that, by 2014, an EPL home advantage had reached an all time low.
Interestingly, that low reached new depths in 2016.
Home teams have won 40.8% of games this past year, pending this weekend’s final contests. If that mark stands, it would be the lowest in EPL/English Division 1 history, one which dates back to 1888.
Here’s a chart, similar to the one that James and Oliver produced. Overall home team win percentage in each year is shown in black, draw percentage in red, and away win percentage in green. The grey region reflects our uncertainty in the trend curve.
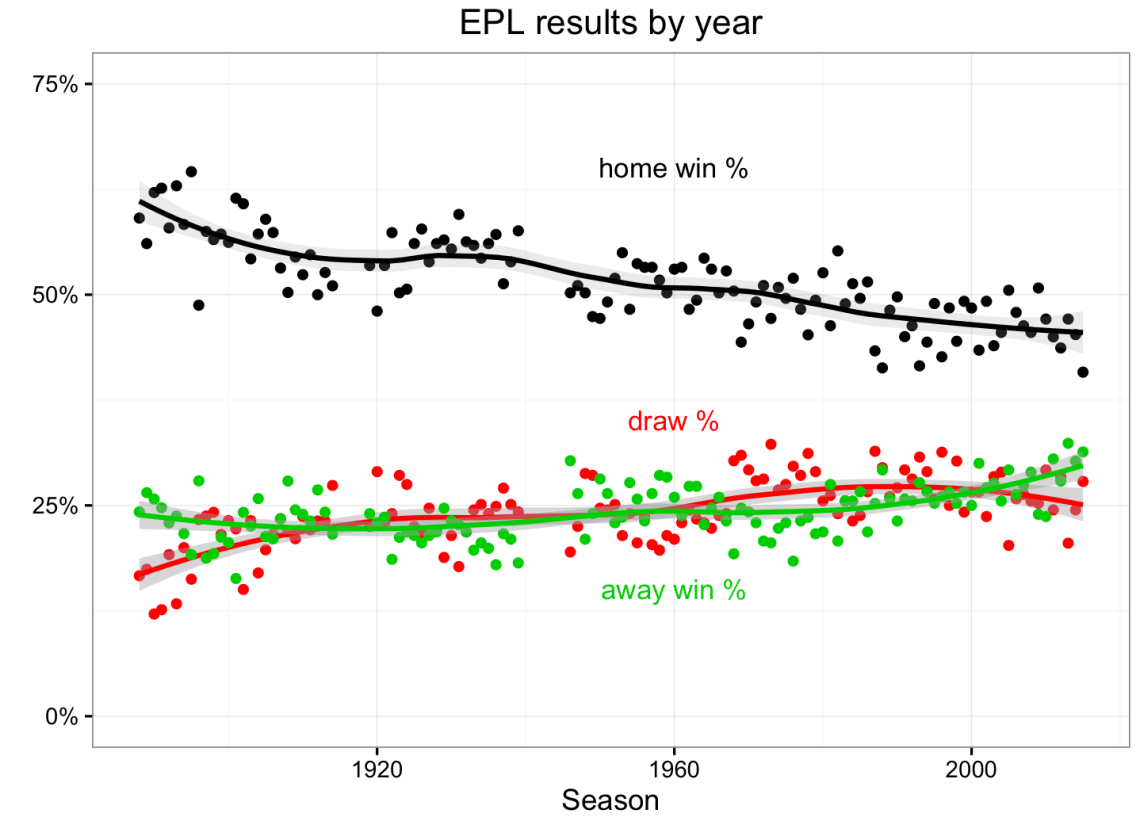
As we knew there’d be, it’s a fairly big drop in win percentage, from roughly 60% to 45% across about 120 seasons. Using this rate of decline, we can expect home teams to win 0% of games by around the year 2400 (I kid).
While win percentage is a useful metric, it’s not perfect, as it doesn’t account for differences in team schedules. If the better teams generally got to host the worse teams, or if winners from previous year were forced to play one another more often (hi, NFL), overall home win percentage would fluctuate as a result. (Note that I am aware that EPL teams currently face each opponent exactly one time at both home and away stadia, which is nice and balanced. However, I’m not sure if that’s always been the case.)
As a result, a paired-comparison method that can account for the team strength of each team, and accordingly estimate a home advantage as a result, could be worth looking at. Using the BradleyTerry2 package in R, and with a hat-tip to James’ engsoccerdata package, I ran a Bradley-Terry model (BTM) with a home-team advantage coefficient within each season. When exponentiated, the coefficient from a BTM reflects a league-wide estimate of the home advantage, taken on an odds scale. As an example, if a team would have a 50% chance of a win at a neutral site (Odds = p/(1-p) = 1), they’d have a 60% win probability with a 50% increase in odds (Odds = .6/(1-0.6) = 1.5). As additional examples, 100% and 200% increases in odds would bump that 50% win probability team to 66% and 75%, respectively.
Here are the season-level increased odds of a home win across the last several decades. Conditional on team strength, in 2015, the odds of a team winning at home were about 25% higher than that team winning a neutral site. While still greater than 0, it’s again the lowest mark in league history.

It’s worth pointing out that the BTM coefficients are estimates, and do come with standard errors attached (generally about 0.12 on the log-odds scale). Even so, it’s interesting that the last 5 seasons all rank among the lowest 10 seasons as far as an estimated EPL home advantage.
James and Oliver posit several reasons as to what caused the drop in home advantage, including ease of travel and referee awareness. Their work also shows that the primary impetus behind fewer home wins is fewer home goals. Interestingly, while home advantage has also seemingly dropped in the NBA, it’s stayed relatively consistent in the NFL, MLB, and NHL.
********************
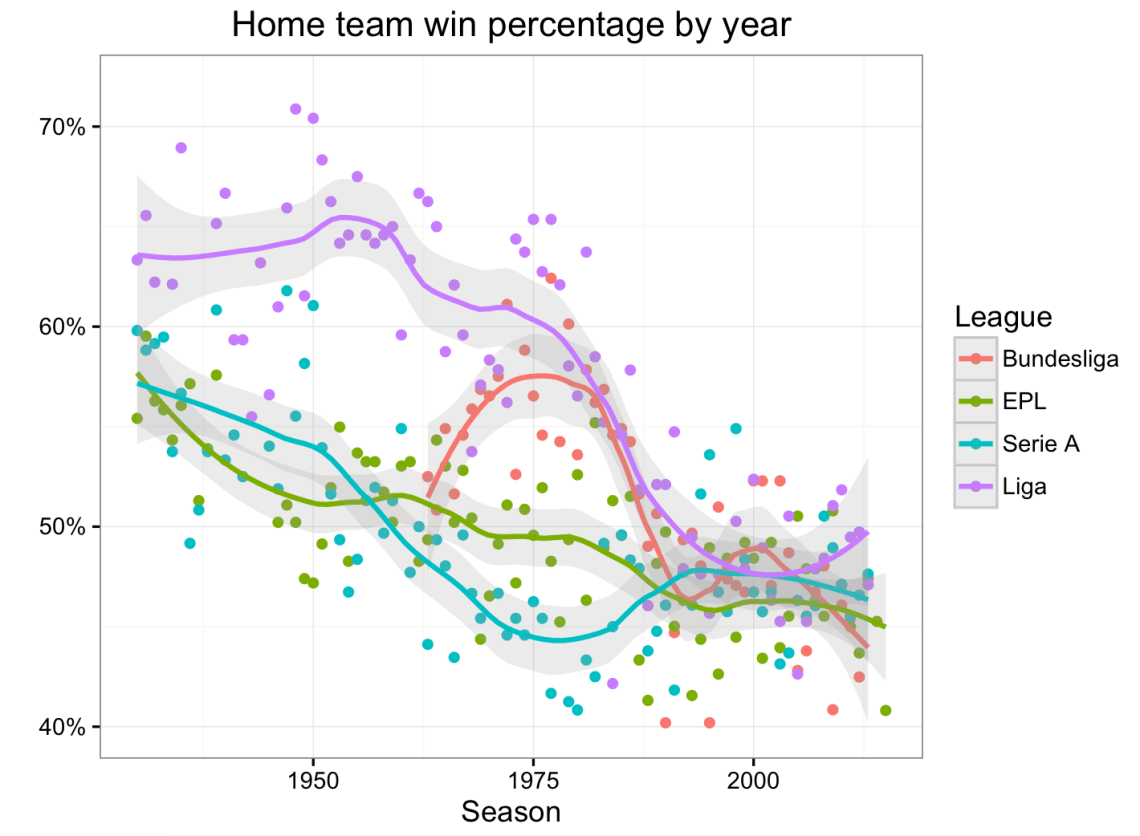
It’s straight-forward to link EPL results with those in other professional soccer leagues. James’ data also includes La Liga (Spain), Serie A (Italy), and the Bundesliga (Germany), so I’ll use those.
Here’s a plot of win percentage across time in each of the four leagues. It’s sort of a cluster, but other leagues seem to match the EPL in terms of a home advantage in recent seasons.
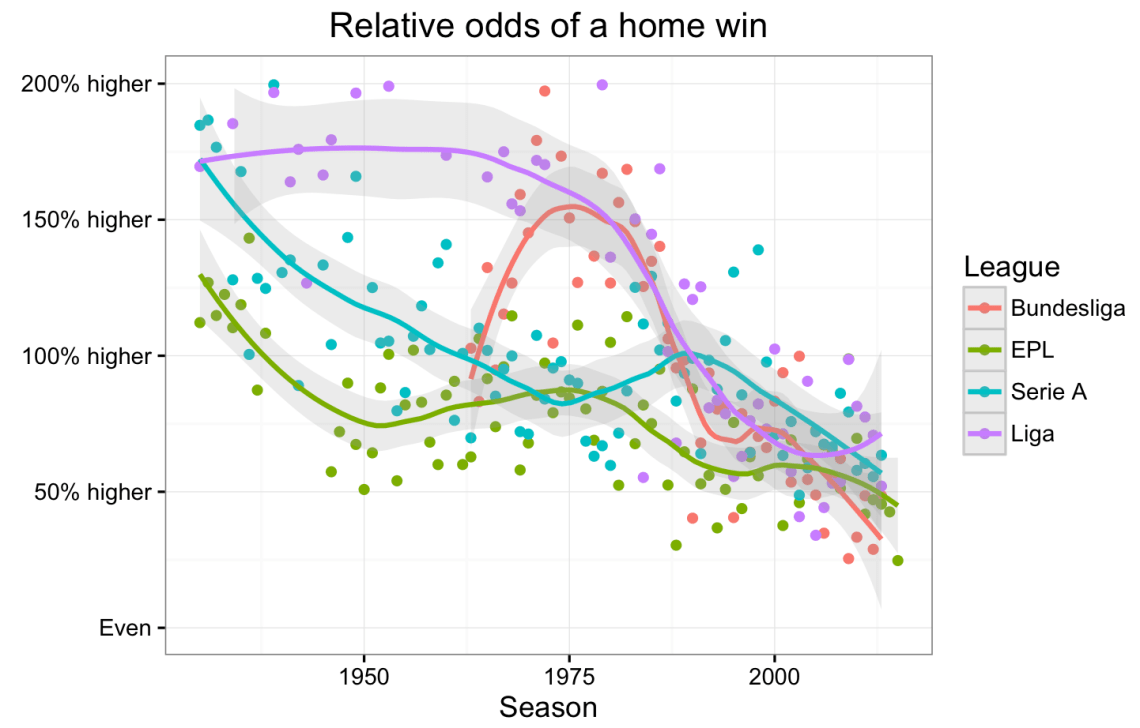
Finally, we can use the BTM in each league in each season to get relative odds of a home win relative to that game being played on a neutral field. Here’s that graph.
Related notes:
-It’d be interesting to go back at each league’s schedule to identify where and why the two graphs above yield different results. For example, there’s a noticeable win percentage gap between the EPL and Serie A in 1975 that’s not apparent when looking at the BTM coefficients.
-The Bundesliga’s home advantage shape is quite strange in the years between 1962 and 1982, showing an inverse quadratic trend over time. I have no logical explanation for such an association. (In fairness, I wasn’t born yet.)
-England switched to a 3-point rule in 1981, while Germany, Italy, and Spain waited until the mid-1990’s. Behavioral economists would do well to look at the impact of rule changes using graphs like these. Generally, most related work only uses a few seasons of play (token plug for my NHL article).
-Nate Silver’s World Cup prediction model was taken to task after its overwhelming optimism for the host Brazilians in 2014. Given the results above, it’s possible that a decline in home advantage across soccer played a role. Nate’s model surely inflated Brazil’s chances because of what was anticipated to be a noticeable benefit of playing at home. But if much of the home advantage that used to exist in soccer was no longer a part of the game, it could explain why a prediction model would do so poorly for the hosts yet do so well when other teams played.
Code is here.

Reblogged this on Stats in the Wild.
“Note that I am aware that EPL teams currently face each opponent exactly one time at both home and away stadia, which is nice and balanced. However, I’m not sure if that’s always been the case”
This has always been the case in the English Premier League/Old First Division since 1888/89. You can look up the results of each game from each season easily enough.
Some leagues have different formats (like the Scottish League, which used to play each other four times a season, then expanded and played some teams three times and some teams four times). But the English League has always operated playing each team home and away.
Very cool. Thanks for the note!