
The website Kaggle sponsored a March Machine Learning Mania contest over the last few months, which involved picking probabilities for every hypothetical NCAA 2014 tournament game.
Points were awarded, or taken away, given how well each submissions’ probabilities fared, relative to everyone else in the pool (for my statistics-oriented readers, it used the loss function from logistic regression). So, if you picked Florida over Albany with probability 0.80, while Florida won, you would’ve lost ground because the majority of entries had the Gators winning with roughly a 95% probability. Meanwhile, if you picked Ohio State over Dayton with probability 0.55, the Dayton win would’ve helped your entry out, with most folks having OSU as a roughly 80% favorite.
Kaggle was kind enough to release histograms of the picks for all submissions, like these ones for the Elite 8 games here (alongside our eventual submissions):
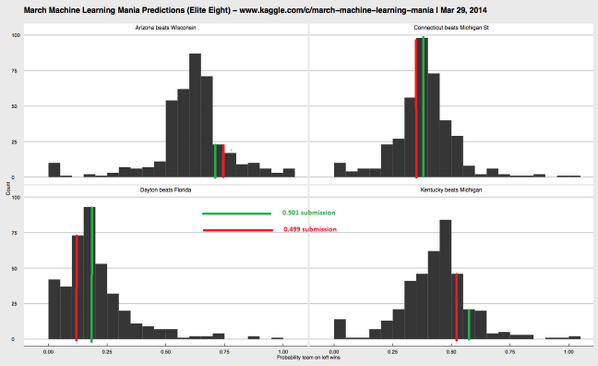
For example, in the top left, the average entry had Arizona as about a 65% favorite over Wisconsin (with our picks, in green and red, a bit higher).
After all games were complete, scores were averaged over the 63-game tournament, with each NCAA contest carrying an equal weight.
Back in February, I received this email, titled “Kaggle,” from my friend Greg, a visiting assistant professor at UMass, regarding this year’s contest.

Having not yet considered an entry, here was my response:

Anyways, as it turns out, Greg and I made the right decision to do Kaggle together.
Our submission, titled One Shining MGF, finished first of about 250 teams. The contest, which was free to enter, was sponsored by Intel, and came with a $15,000 prize. Yay for statistics!
If you are interested in reading more about how we created our model, I encourage you to read this interview.
In summary, our success likely came down to three or four things.
1) Identifying and using the best data.
Our models were relatively simple but our choice of which data to use, and how to best use it, wasn’t. This had to have helped.
2) Knowing the scoring system.
This theme holds for pretty much any sports pool you’ll ever enter, and it certainly helped us here.
While there were lots of tools at our disposal, we focused on using forms of logistic regression, as submission probabilities were eventually judged using this loss function. In particular, this metric carried a severe penalty for failed picks which were made with high confidence (i.e., if you picked Duke at 98% over Mercer, you were more or less eliminated when Duke lost). Jeff from Kaggle provided a nice summary of this extremes idea here.
3) Luck.
It’s March Madness, after all. Specifically, had Kentucky beat UConn in the final game, our entry would have finished in second place.
We’ll have more on the specifics of our entry over time (Greg will post something on his blog, too), and we are hoping to submit to the Journal of Quantitative Analysis in Sports’ Call for Papers, where we will further detail some of our choices.
Cheers, and thanks to Kaggle for a fun and informative contest

Reblogged this on Stats in the Wild and commented:
…and we won.