
If there was any doubt that so-called nerds are starting to take over the sports world, look no further than the New York Times 4th-down bot, a collaboration with Brian Burke of http://www.advancednflstats.com, which features minute-by-minute analysis of NFL coaches’ fourth-down decisions.
At each fourth-down in an NFL game, the Bot will spit out which choice – punting, kicking a field goal, or going for it – is optimal, based on either maximizing that team’s expected point total or its chances of winning the game. It’s a pretty neat website, and I took a few days to explore the Bot before coming up with the following thoughts.
What I like
- For starters, its a great idea, and the website setup is outstanding and easy to navigate.
- I like how when you click on each decision, the Bot explains win probabilities, or expected points, in relatively straight-forward fashion. For example, the Bot recommended that the Patriots should have gone for it instead of kicking the field goal during their game-winning drive against the Texans, because teams that go for it in such situations would win 58% of the time, versus a 54% win probability among teams that kicked. Pretty cool to follow that live and to see the math almost instantaneously.
| OPTION | TEAMS DOING THIS WOULD WIN… |
THIS SUCCEEDS ABOUT… | COACHES DO THIS…* |
|---|---|---|---|
| Go for it | 58% of the time | 60% of the time | 52% of the time |
| Field goal try | 54% of the time | 50% of the time | 10% of the time |
| Punt | 52% of the time | – | 38% of the time |
- The future opportunities to explore coach and team behavior. Which coaches are most conservative? Most aggressive? In time, the Bot will give us much of that information.
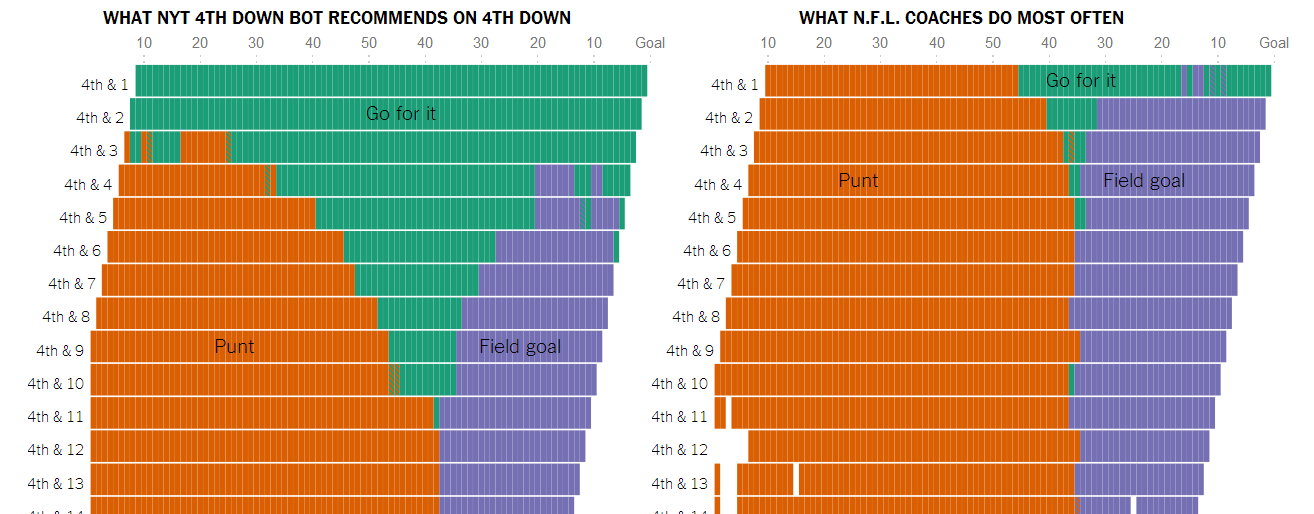
- The graph on the front page, which I linked above. Pretty incredible to see how rare coaches go for it on fourth down, relative to how often they should. That graph was well put together.
What I don’t like/what needs improvement
- I don’t like how the Bot treats every decision as cut and dry, or that every decision has a correct answer. This point has already been made:
However, I’d like to expand.
For starters, there might be no real difference between a decision that gives you a 54% chance of winning and one that gives you a 58% chance. Each of those point estimates (0.58, 0.54) comes with some type of error. In the Patriots vs. Texans example above, the Bot made its decision based on “about 300 fourth downs with similar field position and distance.” Assuming this is the case, I’d estimate the margin of error associated with these win probabilities is around 0.10 (likely even higher, given that the bot is using similar field position and distances, and not exact field position or distances). As a result, the win probability confidence intervals for kicking a field goal (something like 44%-64%) and going for it (48%-68%) would easily overlap. There’s no detectable difference between the two decisions, at least based on these numbers. But the Bot doesn’t tell us that.
Second, even if point estimates came with no margin of error, the difference between 55% and 54%, as an example, would be about 1 win every 6 seasons seasons. A minor point, but effect size is lost when you take the Bot’s decision as binary only, and don’t click on the link to explore the details. These types of shortcomings don’t get brought up on Monday at the office when people say “well the Bot says the team should have gone for it,” because, of course, people like decisions as cut and dry. When the difference between decisions is neglible, it would be nice for the Bot to admit that there’s a “grey-area” and just write “too tough to call.” Instead, there’s always a decision.
- The Bot assumes its win probability and expected points calculators are the truth. This might be a major shortcoming. Here, the Bot is using prediction models from Burke’s website, which estimates the win probabilities for each team at each point in the game. The Patriots vs. Texans win probability chart, for instance, is here. After Gostowski’s field goal, the Patriots are listed as having a 71% chance of winning the game.

It’s fairly obvious in this graph that something could be improved upon in Advanced NFL stats’ calculations: at the beginning of the game (on the far left of the graph), the Patriots and Texans are shown to have an equal chance of winning the game. This was pretty clearly not the case. Based on the Las Vegas spread, in fact, the Patriots (favored by 7.5 points) were about four times as likely to win that game. When it comes to fourth down decision making, knowing which team is the favorite is a pretty important factor, because underdogs, in general, should make the more aggressive decisions.
Moreover, there are other win probability calculators out there which may provide different decisions. Trey Causey at http://thespread.us/ is working on one (and he insists there will be margins of error!), and the folks at Prediction Machine have another. At the New England Symposium on Statistics in Sports, Dennis Lock from Iowa State showed another, which can be seen here. Both Prediction Machine and Lock’s formula do not make the assumption that each team has a 50% chance of winning the game, and as a result, might be able to more accurately judge each team’s decision.
- It’s minor, and related to the points above, but I’d like it if the NYT and the Bot wrote “teams doing this would win an estimated 58% of the time,” as opposed to “teams doing this would win 58% of the time.” The Bot, as cool as it may seem, doesn’t know the truth. Like the rest of us, he, she, or it can only estimate it.
To finish on these points, the Bot is a great step in showing how basic probabilities can improve NFL in-game decision making processes. However, because the win probability calculations behind the Bot are likely not 100% accurate, and because these numbers do not come with a proper acknowledgement of error, there is still plenty of work left to do.

You would have saved yourself a lot of time if you had read what Brian Burke himself wrote about it: “As always, the models’ estimates are league-average baselines, and local factors do matter. The recommendations are starting points of analysis, not the end of the discussion. Still, this should be a fun and entertaining way to spread the word about the capabilities of analytics.”
Fair point. Maybe its just me, however, but I wouldn’t put win probability estimates, or decision making rules, on the New York Times website, if I knew they were flawed and could be easily improved.
Reblogged this on Stats in the Wild.
Which sports models, or models of any kind, do you find to be flawless and unimprovable?