
“There are lies, damned lies, and statistics”-Mark Twain
There was an interesting post at sportsinsights.com earlier today, which looked at the performances of West Coast NFL teams based on game location. The authors hypothesize that “NFL West Coast teams traveling east suffer declines in performance.”
It’s an interesting idea, and, if true, could make the NFL re-think scheduling, which often requires teams to travel thousands of miles on consecutive weekends. Moreover, I liked how the authors looked at team performance against the spread, in contrast to this article at Advanced NFL Stats, which simply looked at team performance, and thus was not able to account for difference’s in the abilities between teams on different coasts.
The topic was interesting enough that it was look at by more than 12,000 viewers (as of 4:52, Friday) when linked by Deadspin.
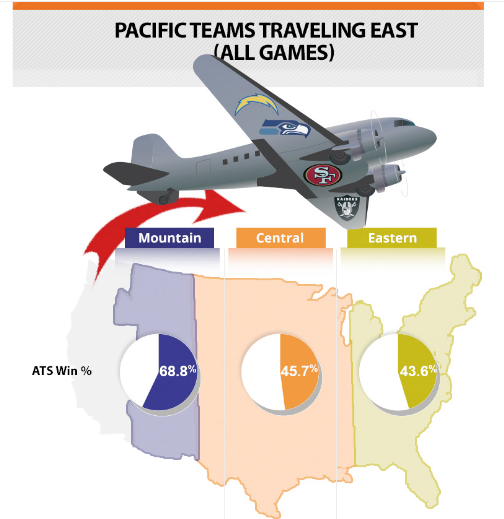
Further, the results of the Sports Insights study are interesting. The writers, using all games since 2005, find that West Coast teams (Seattle, San Francisco, San Diego, and Oakland) perform worse as the game location moves further East. The following graph pretty much summarizes these results, as they find West Coast teams records to be strongest for games played closer to home:
Two things struck me when reading this article and surmising its validity. First, are these results statistically significant? Second, why 2005? Why not go further back in time? Next, I answer these questions.
First, are these results statistically significant?
A basic statistics test can help identify if these patterns are random noise or if the authors are onto something.
First, I compared each proportion (22/32 = 0.688, 37/81 = 0.457, 44/101 = 0.436) to the proportions which would have occurred (in all cases, 0.5) had the game result (West coast team covers or fails to cover) been random. In only one situation (Mountain Zone games), are the results approaching statistical significance (p-value = 0.04). For both Central and Eastern time zone games, the results are not significant (p-value > 0.10).
Other tests (Chi-squared test of association, for example) yield relatively similar results. There’s evidence of a pattern, but its borderline significant and still can be attributed to chance.
Second, what if the authors had used more (or less) data? Why did they stop at 2005?
In my opinion, this was the more important question to answer. It took all of a ten-second google search to find NFL data going as far back as 1981, with home and visiting opponent, spread, and game result. In fact, this site is amazing, with .csv files for each year from 1981-2012.
I extracted this data and uploaded it, going back in time to answer a few questions.
What if the author’s had chosen different endpoints?
I went back and used all years since 1981 as my limiting end point, estimating the same proportions at each season; cumulative West Coast team ATS record through 2012 by game location. The results are plotted below.
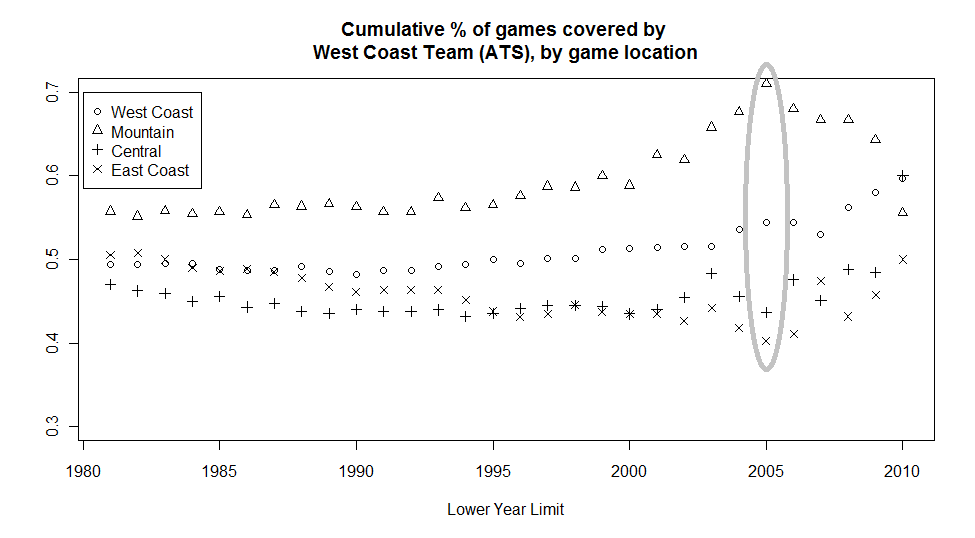
The results were surprising. While I obviously don’t know that the author’s chose 2005 to tell the strongest story, the graph above certainly finds the choice of 2005 suspicious. Specifically, using game data from 2005-2012, there appears to be the largest gap between West Coast ATS percentage by game location. At all other yearly end points, West Coast teams playing in the Mountain time zone have lower ATS percentages than in 2005, and West Coast teams playing in the Eastern time zone have higher ATS percentages compared to 2005.
Moreover, I also included West Coast team performance ATS when facing non West Coast teams at home (the circles in the graph). This number was not included by the Sports Insights folks. If West Coast teams played better when closer to home relative to expectation, one would expect to see this percentage above 0.5. As it turns out, West Coast teams have covered 49.5% of home games against non West Coast teams since 1981.
I hope this raises an eye for Deadspin, who, as they start their promising “Regressing” blog, should have a keen eye for selective endpoints. Moreover, there are several questions that remain. Has performance (relative to home location) changed over time? Also, what if East Coast teams are used as the reference group? In the future, I might try and, err, tackle these questions.

Reblogged this on Stats in the Wild and commented:
I tweeted earlier today expressing sketicism about an article I read on the Regressing section of Deadspin about west coast football teams travelling to the east coast. I thought that when I had some time tonight, I’d downlaod the data and explore the question myself, but it looks like Mike Lopez (@statsbylopez) beat me to it. And my skepticism may have been warranted.
Cheers.
The irony for Deadspin is that surely your post, Mr Lopez, is far more interesting than the original (although they do have a lovely infographic).
The same figures get trotted out here in Australia, re Aus Football League teams travelling between Melbourne and Perth – the home bias / controversial calls post is a much more plausible explanation.
haha, thanks… and interesting note on Aus football leagues
I should have added to my previous comment, re the Aus Football League – that this is assuming that there is any demonstrable discrepancy at all in east coast / west coast travelling results. (I haven’t seen any effort to do it, yet.)