
The start of hockey season has some NHL teams up to their usual tricks. While the overall probability of overtime games has been relatively low (17% in divisional games, 21% otherwise), a few play-by-play sheets have jumped out at me.
Last night, for example, Buffalo and the Islanders combined for 133 shots (on goal or missed) in first 58 minutes of hockey… but none in final two minutes!
I dug out some R code just to create a few quick plots that highlight how NHL overtime likelihood has changed, by game type (conference or non-conference) , game month, and by season.
First, here’s a plot of overtime probability (with error bars) for the 2005/06-2009/10 seasons, separated by a conference indicator (TRUE = conference, FALSE = nonconference). It doesn’t appear as if there are any noticeable trends.

Next, here’s the same plot (with the same y-axis) using the 2010/11-2011/12 seasons.
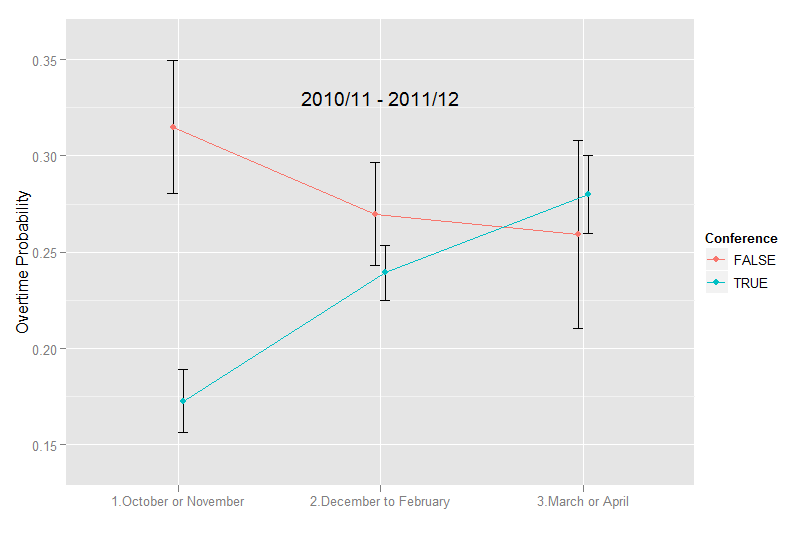
Note: the error bars are wider for the recent seasons (and in nonconference games) because there have been fewer such contests.
The differing behaviors between a teams conference and nonconference games is readily apparent, but only in the last two non-lockout seasons. Nonconference games played in October and November went to OT roughly twice as often as conference ones.
Moreover, playing for OT is much more popular in the latter months of the year, when the playoffs are approaching, at least with conference games.
A few folks have inquired as to whether or not this could be used to win bragging rights in Las Vegas. One possibility is taking the underdog in all nonconference games at +1.5. However, the numbers (not shown, but I looked) suggest that nonconference games aren’t necessarily closer, its just that a higher proportion of nonconference games which are already close reach overtime.
Another possibility is NHL 3-way lines, in which you can wager directly on a draw. Generally, these lines are around +300 for each game…and so if you can identify scenarios in which there’s at least a 25% chance of a game going to OT, this strategy might be advantageous. If anyone has historical 3-way lines (from this season, or any recent season), I’m willing to go back in time and see how this strategy would’ve worked out.
I’ll continue to monitor team behavior all winter, and in future posts, I’ll also begin to highlight which teams appear to have identified the benefits of nonconference OT games the most.
