
There’s a fun reddit thread going around that shows the work of Joey Faulkner, who identified the varying ways in which officials spot the ball in the NFL. The graph shows pretty powerful evidence that implies refs make a subconscious decision to spot the ball near round numbers. In football, those round numbers are multiples of five.
The initial plot is pretty easy to replicate. Here it is, thanks data from Armchair Analysis.
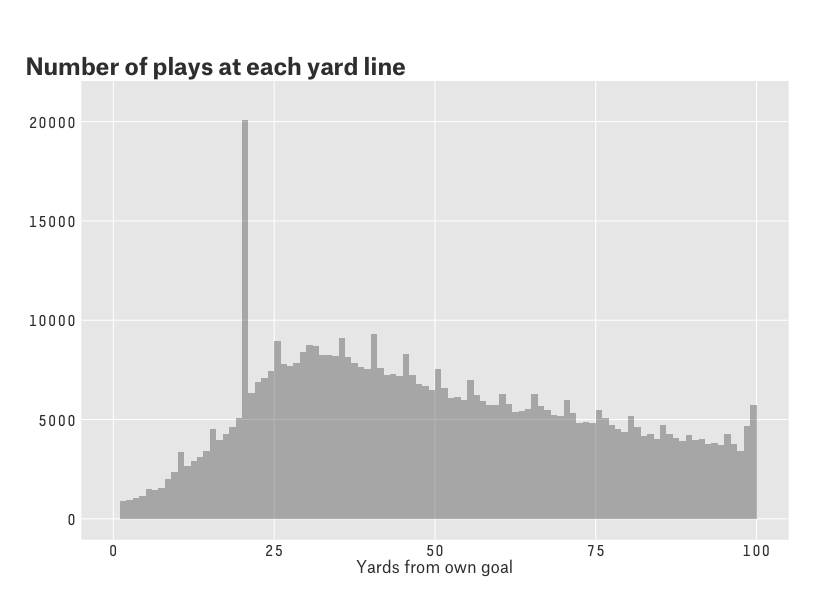
Pretty cool to see all of the peaks near round numbers in the graph.
One possible issue with the graph above, however, is that many NFL drives initiate at the 20-yard line (after touchbacks), and, to a lesser extent, the 40-yard line. As a result, given the frequency of 5 and 10 yard penalties, we could expect to see fewer peaks on round numbers when dropping these drives.
So I dropped any drive that began at a team’s 20 or 40 yard line. Here’s the same plot.

By and large, we see the same results. There are peaks at all of the five-yard marks, which mostly reflect the original figure. As a result, it doesn’t appear the touchbacks and penalties are driving the findings.
However, I’d like to throw one more theory out there, which deals with player behavior. Take a closer look yard lines between 50 and 90 yards from the offensive team’s own goal.

While there are obvious peaks at multiples of five, those peaks appear to be coming at the expense of plays just short of those yard lines. Meanwhile, just after multiples of five, there are still several spikes. For example, compare yard lines like 56 and 54, 61 and 59, or 76 and 74. In each scenario, there are far fewer plays just short of the round number than there are afterwards.
It’s as if we have a series of skewed right histograms, beginning every five yards. Why is that? If there was a referee bias towards round numbers, wouldn’t it come evenly at the expense of plays just short and just after the five yard-line thresholds?
Well, one alternative is that the players themselves causing part of the funny shape. It is well known that athletes shoot for arbitrary thresholds, like the triple double in basketball, hitting 0.300, or running a sub 4:00 hour marathon (see this fun image about runners, for example). Perhaps when given the choice of whether or not to extend the play, football players are also shooting for round numbers, too.
Here’s code if you want to replicate the plots yourselves.
</pre>

library(readr)
library(dplyr)
library(zoo)
A <- read_csv("PLAY.csv")

A1<-filter(A,dseq>0)

A1$initial<-A1$dseq==1
A1$drive.start<-ifelse(A1$initial,A1$yfog,NA)
A1$drive.start<-na.locf(A1$drive.start)

A1<-filter(A1,yfog!=0)
A2<-filter(A1,drive.start!=20)
A3<-filter(A2,drive.start!=40)

ggplot(A1, aes(x=yfog)) +
geom_histogram(alpha=0.4, position="identity",binwidth = 1)+
scale_x_continuous("Yards from own goal")+Five38Thm+scale_y_continuous(lim=c(0,21000))+
theme(legend.text=element_text(size=16))+ggtitle("Number of plays at each yard line")
ggplot(A3, aes(x=yfog)) +
geom_histogram(alpha=0.4, position="identity",binwidth = 1)+
scale_x_continuous("Yards from own goal")+Five38Thm+scale_y_continuous(lim=c(0,21000))+
theme(legend.text=element_text(size=16))+ggtitle("Number of plays at each yard line")
ggplot(A3, aes(x=yfog)) +
geom_histogram(alpha=0.4, position="identity",binwidth = 1)+
scale_x_continuous("Yards from own goal",lim=c(50,90))+Five38Thm+
theme(legend.text=element_text(size=16))+ggtitle("Number of plays at each yard line")
<pre>
