
A few weeks back, folks in the Harvard Sports Analysis Collective (HSAC) looked at the shooting rates of NBA players based on whether or not the game fell on a Sunday (link). While the evidence was mostly inconclusive in the HSAC study, I thought it was a good idea to check for whether or not similar results exist during Sunday NHL games.
Piggybacking on recent work from Carnegie Mellon’s and War-on-Ice’s Sam Ventura, I calculated the expected goals in each NHL contest between the start of the 2005 season and February 1, 2015, which is done using a logistic regression model based on the type of shot, shot location, and shot distance. This was done based on both the game’s minute, score, and the day of week in which the game was being played. Here, note that I’m using expected goals, which Sam and other folks have shown to be as if not more predictive of future goals than traditional statistics like goals or shots.
Looking at the first period, I plotted the expected goal rate per each tied-game minute (Minute 1 through 20), using a different color for games that occurred on a Sunday and those occurring on all other days. I also included 95% confidence bands for the loess smoother, although I should note that these are the default bands in the ggplot2 package, and might not fully account for the variability in each rate.
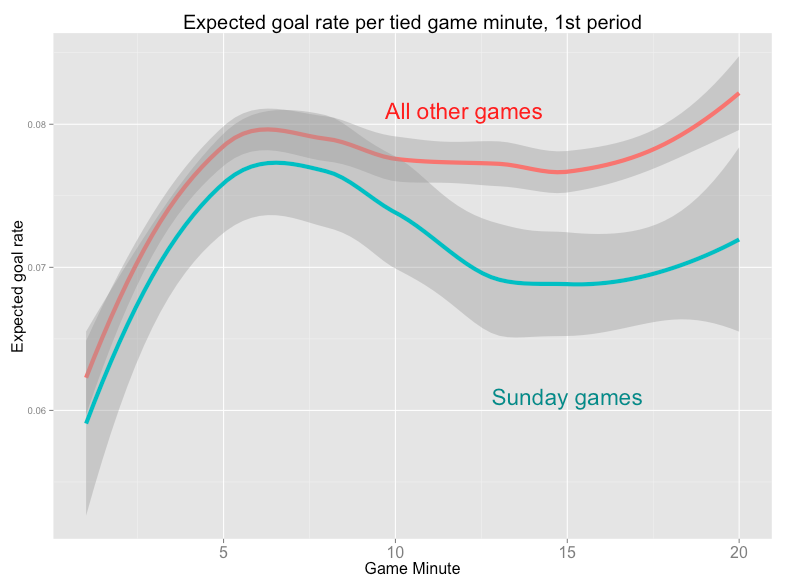
At any rate, the difference between Sundays and all other days of the week was much larger than I anticipated. It does seem plausible that Sunday NHL games take a less aggressive tone, at least in terms of expected offensive output.
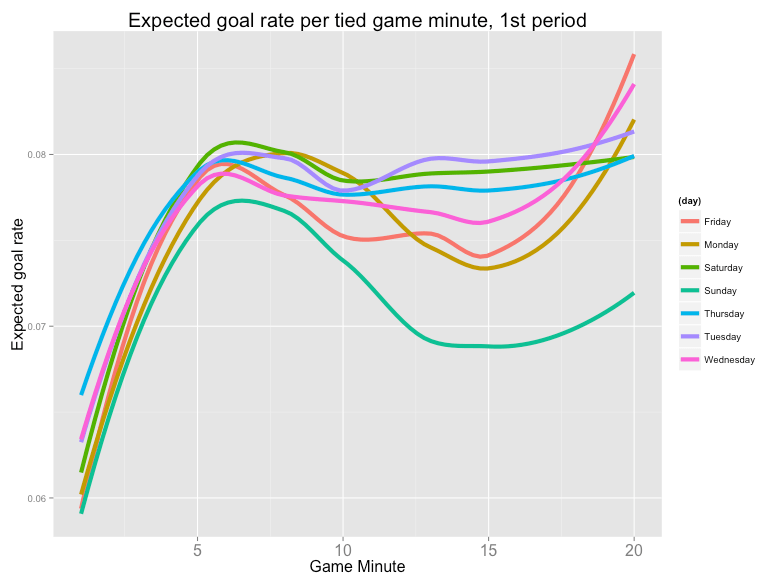
And here’s a plot of Sunday compared to every other weekday:
Of course, its impossible to tell exactly what drives potential drops in expected goals based on Sunday. For example, it could simply be that Sunday games tend to be the second of back-to-backs for one or both participating teams, which might cause tired legs. It could also be that Sunday games tend to feature matinees games, although the same could be said for Saturday (Note: reader Justen Fox notes that nearly all Sunday games are played before nighttime, compared to only about a quarter of Saturday games)
In any case, I thought that this was an interesting result worth sharing.
Also, I’m working on a more extensive and related project that should finish up within the month, and at that point, I’ll happily share code.

Interesting choice of y-axis min. value. Aren’t you the same guy who railed on the Belichick fumble study for choosing a y-axis range that exaggerated the distance from the norm of an outlier?
Hi evo34,
Thanks for reading. In my opinion, inclusion of confidence bands for errors helps highlight the differences between the days, and so there is less of a worry about the y-axis scale. Also, I mentioned a couple of times that this was just an interesting result, and just highlights a potential area for further study.
So, to summarize: yes, you are the same guy who spent the better part of an article railing against someone else’s arbitrary choice of y-axis endpoints…and then proceeded to do the same thing yourself. Nicely done.
Could it be something to do with which teams play more Sunday games than others?
Definitely a possibility…