
This upcoming weekend in the NFL playoffs, Seattle is favored to beat Carolina by 11 points, and the over/under for the game has been set at 40 total points. A loyal reader points out the following:
It's just so unusual (in my mind) to see 11 point spread with a total as low as 40
This brings up a few questions, centered around the idea of a correlated parlay. In a correlated parlay, if one of the bets successfully occurs, it is also increasingly likely that another successful bet will occur. For example, placing a bet on the Cavaliers to win the NBA finals and LeBron to win Finals MVP is a correlated parlay, because if the first occurs, the second is also likely to occur (h/t to @wmguo for the example).
My goal in this post is to consider whether or not NFL totals and game spreads were correlated. To do so, I used Sunshine’s NFL historical database (here), and extracted every regular season game since 1979. This yields about 8,000 games. Next, I split the game’s line into (roughly) evenly spaced quantiles, before answering the following questions.
Question 1: Does the spread outcome (over vs. under) correlate with the game total?
Here’s a graph of the likelihood of the game hitting the ‘over’ by spread interval. Most of the graph is evenly scattered about 0.5, although on the extremes, there is some variation. The dot in each graph is the sample proportion, and the lines represent 95% confidence intervals for each of these point estimates.

So, overall, it doesn’t look like there’s any obvious trend in betting the game’s total based on its spread. This is expected. It shouldn’t be that easy to predict game totals.
2) Conditional on knowing whether or not the favorite covered, what does the graph look like?
As an example, if the Seahawks cover this weekend, that means there will have been at least 12 points scored in the game. Would this information aid in making a decision on the game’s total?
Here’s a graph of the over probabilities in games in which the favorite covered:

And here’s a graph of the over probabilities in games in which the underdog covered:

Overall, it doesn’t look like there’s much association between the game’s line and total, even when knowing whether or not the favorite covered.
4) But what about games with extreme totals?
Here are some more graphs, in which I look at games with lower (<41) or higher (>51) totals.
Looking at games where the total was 40 or below in which the favorite covered, there does seem to be a weak association between the game’s line and the total. On the right and left sides of the graph, notice the point estimates above 0.50.
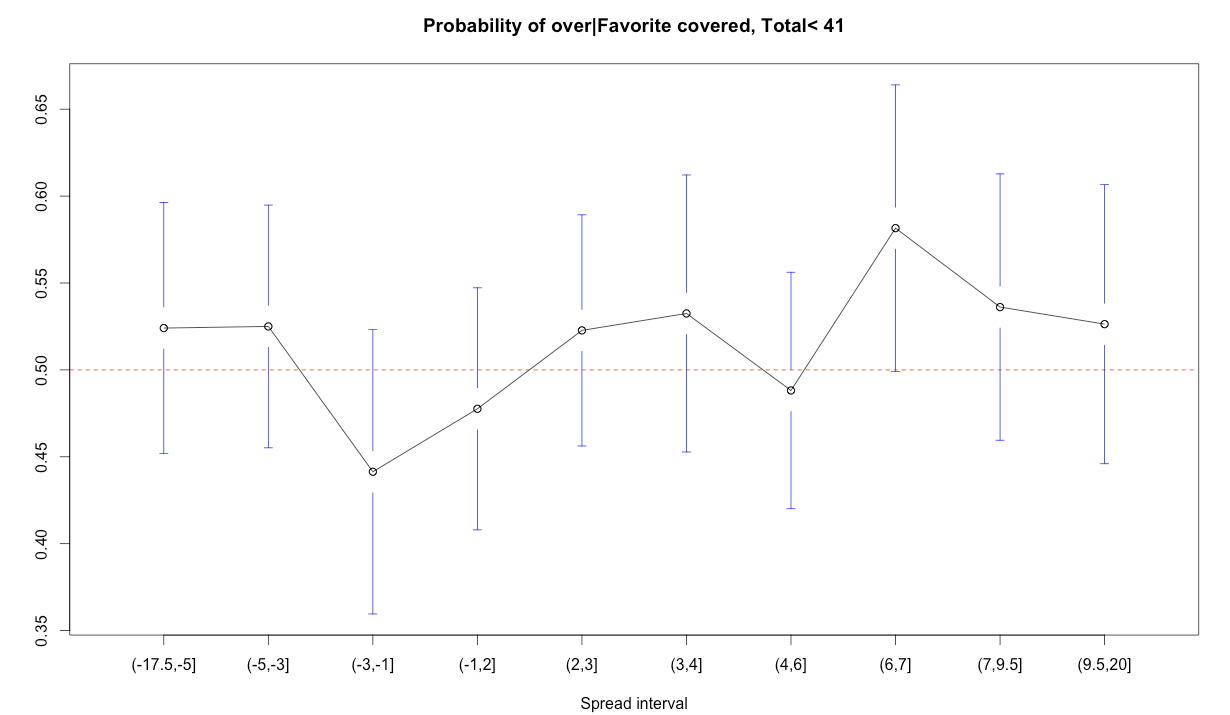
In games in which the favorite covered such a large spread with a smaller game total, the over hits about 55% of the time. Interesting, but not a crazy strong association.
Finally, looking at games with extremely high totals (51 or above), here’s a graph of the probability of the over conditional on the favorite covering.
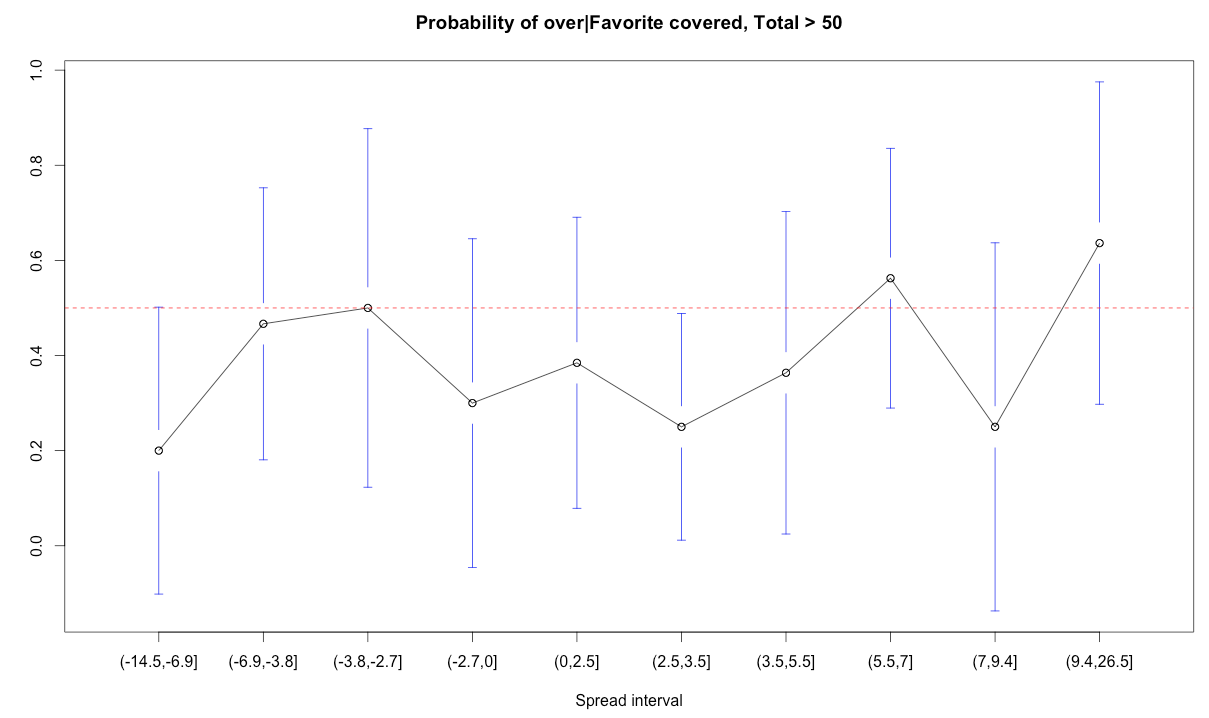
This was also interesting. It looks like for several of the intervals above, when the favorite covers there was a possible a tendency for a higher proportion of unders. In the graph, this is shown by several of the point estimates (particularly in the middle of the graph) falling below 0.50.
Of course, we are looking at several intervals and several situations, and its certainly feasible this trend could be due to chance. Further, the league has changed over the past several years, and information from a few decades ago might not be all that applicable.
Overall, it looks like any associations between the game’s total and spread results are limited. Thus, if you like Seattle this weekend to cover against Carolina, don’t feel like you have to take the over or the under to go with it.
****
As a postscript, I got two great responses when I posed a related question on Twitter.

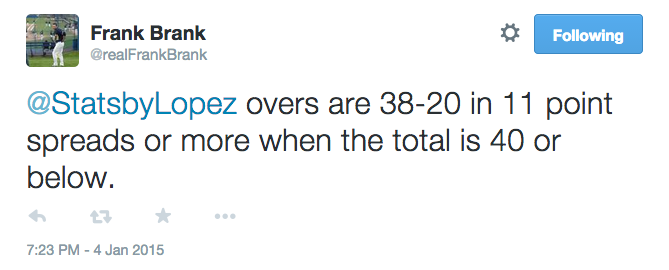
I followed up with Frank, who was using only more recent data (2003-current), while also including the playoffs. Interesting, as I got between 55% and 60% looking at regular season data over a longer time period.

A better test is looking at [total – abs(spread)], and taking the bottom ~15% of all games. Then compare over success rate when favorite covered vs. when dog covered.