
Last Spring, Loyola University Chicago statistics professor Greg Matthews and I won the March Machine Learning Mania contest run by Kaggle, which involved submitting game probabilities for every possible contest in the 2014 NCAA men’s basketball tournament.
Recently, we co-wrote a paper that motivates and summarizes the prediction model that we used. In addition to describing our entry, we also simulated the tournament 10,000 times in order to help quantify how likely it was that our submission would have won the Kaggle contest.
The paper has been submitted for publication at a journal, and we are crossing our fingers that it gets accepted. The pre-published version of the paper is up on arXiv (linked here).
Quick summary: to estimate the probabilities for each game, we merged two probability models, one using point spreads (Rd. 1) and estimated point spreads (Rd. 2- Rd. 6) set by sports books, and the other using team efficiency metrics from Ken Pomeroy’s website.
According to our simulations, we estimate that our odds of winning increased anywhere between 10-fold and 50-fold, relative to if the contest winner had been randomly chosen. Even under the most optimal of game probability scenarios, however, that entry had no more more than a 50-50 chance of finishing inside the top-10 of the Kaggle contest standings.
Also, we made this density plot of the winning Kaggle scores over all tournament simulations and under the simulations in which our entry was victorious. Overall, our winning scores tended to have a lower distribution in the tails.
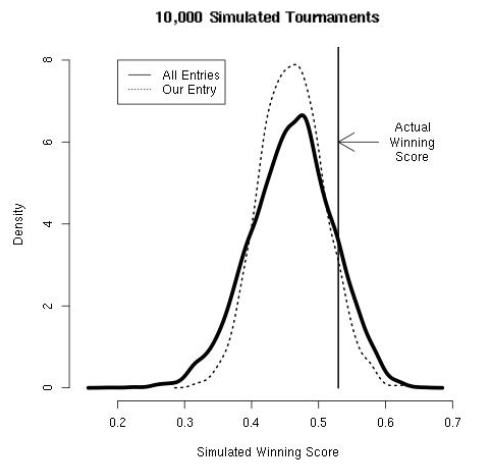
Figure: Kaggle contest score under the log-loss function
Also, we found that the 2014 winning score was relatively higher than under most tournament simulations. We posit that because a 7-seed (UConn) won the national title, the larger number of upsets likely resulted in increases to the loss function.

Reblogged this on Stats in the Wild.
Thanks for writing this up; I look forward to reading the paper.