
Like it probably did at many institutions, student registration opened this past week for the Spring semester at Skidmore College.
As a statistics professor in the Department of Mathematics and Computer Science, I was struck at how quickly the courses in our department filled up. Was it like that elsewhere at Skidmore?
Using public data available from the registrar (here), I extracted the course enrollments for each of the school’s departments. Next, after dropping independent studies and a few similarly designed courses, I categorized each course as either “Closed” (waitlisted at 5 students or more), “Filled” (spots remaining on the waitlist only), or “Open” (enrollment less than capacity).
Next, in a few cases, I aggregated departments that were very similar (say, foreign languages, or math, computer science, and statistics) to simplify things. Further, due to the small sample sizes of courses offered in a few departments (ex: Asian studies), I also had to restrict my analysis to departments which are offering at least 8 courses in the Spring.
In any case, here’s a mosaic plot featuring the course status (y-axis) by department. The width of each department’s x-axis is proportional to the number of courses offered by that department in the Spring. For example, the English department and the Art department (which is a conglomerate of art history and arts administration) offer more courses than any other department.
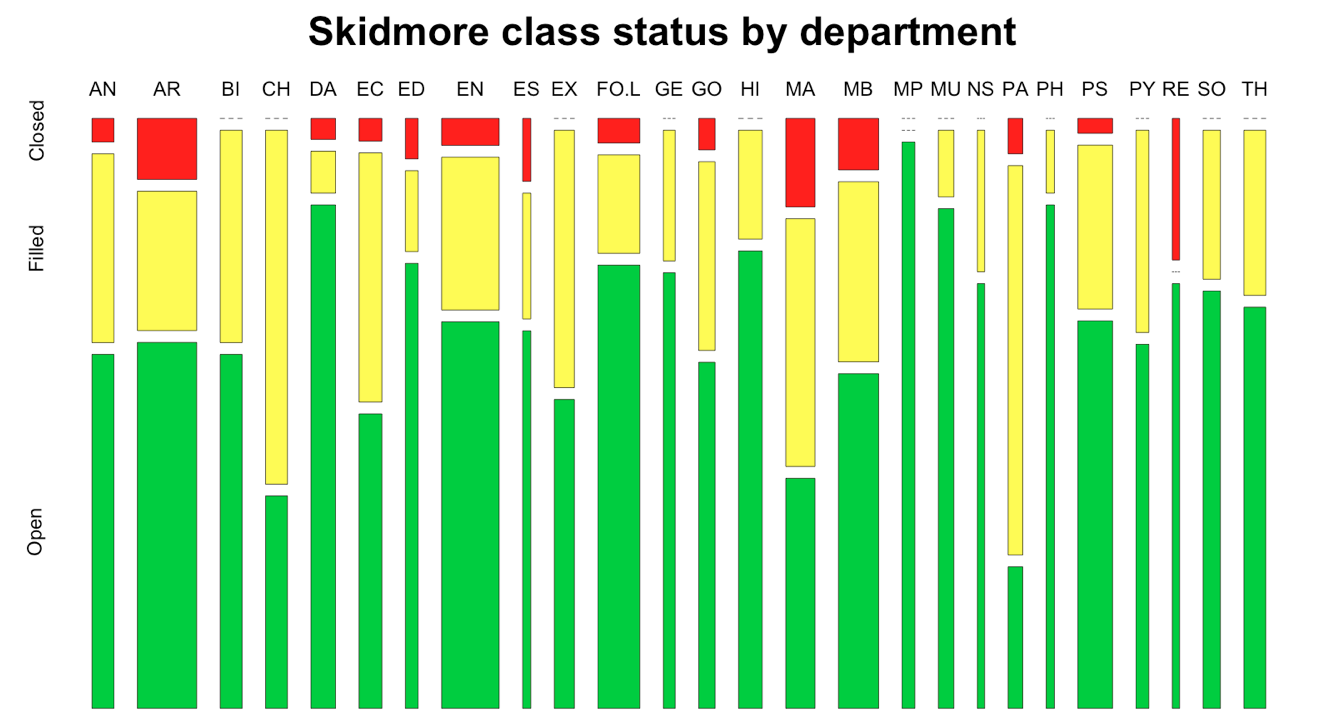
The Department of Math & Computer Science is abbreviated MA, and, as indicated above, boasts among the largest percentage of courses which are closed (red) and filled (yellow) the Spring. The “PA” department, if you are curious, is also doing well; it’s the Department of Physical Activity.
So, apparently, Skidmore students are desperate to differentiate some integrals but it makes them want to exercise afterwards.
Most department abbreviations are what you expect them to be – the first two letters of their name – but because my interest was mostly in comparing mathematics to other departments as a whole, I was purposely vague with the labeling.
So, overall, it appears enrollments in my department’s courses are doing well.
Other notes:
-Restricting to courses designed for larger enrollments (in general, these are 100 and 200 level courses) exacerbates the enthusiasm students are showing for courses in the math department. Here’s that plot.

-It might be unfair to treat all course offerings in the same manner. This only makes for one quick look at the data.
-If you are curious, statistics courses did well enough that there is a chance another one might be added!
-Perhaps this shouldn’t be surprising; math is a sexy choice for the future (as per Jacob Rosen), who writes “A math major – or at least several courses in math – can be the differentiation point to lift your resume to the top of the pile.”
