
A few months ago, I wrote about how looking at the Westgate Hotel’s Super Contest, in which contestants pony up $1500 to pick five NFL games per week against the spread, could make for some interesting data analyses.
In this post, I’ll dig into the data to try and answer a few interesting questions.
What teams have been picked most often? And do betters ride the `hot-hand’?
Economist Brad Humphreys and colleagues have an interesting paper that found that NFL bettors believe in the hot-hand; that is, there is a significant increase in bets among teams entering games on winning streaks. If that were the case, we could expect teams supported in the Super Contest to be the ones that have been previously successful.
Here’s a plot of the weekly support for each NFL franchise, organized by division (West to East) and team. The size of each circle is proportional to the number of bettors in the Super Contest which backed that team, and the color of the circle depicts whether or not that team covered the spread in that week (green is a win, red is a loss, and click to enlarge).
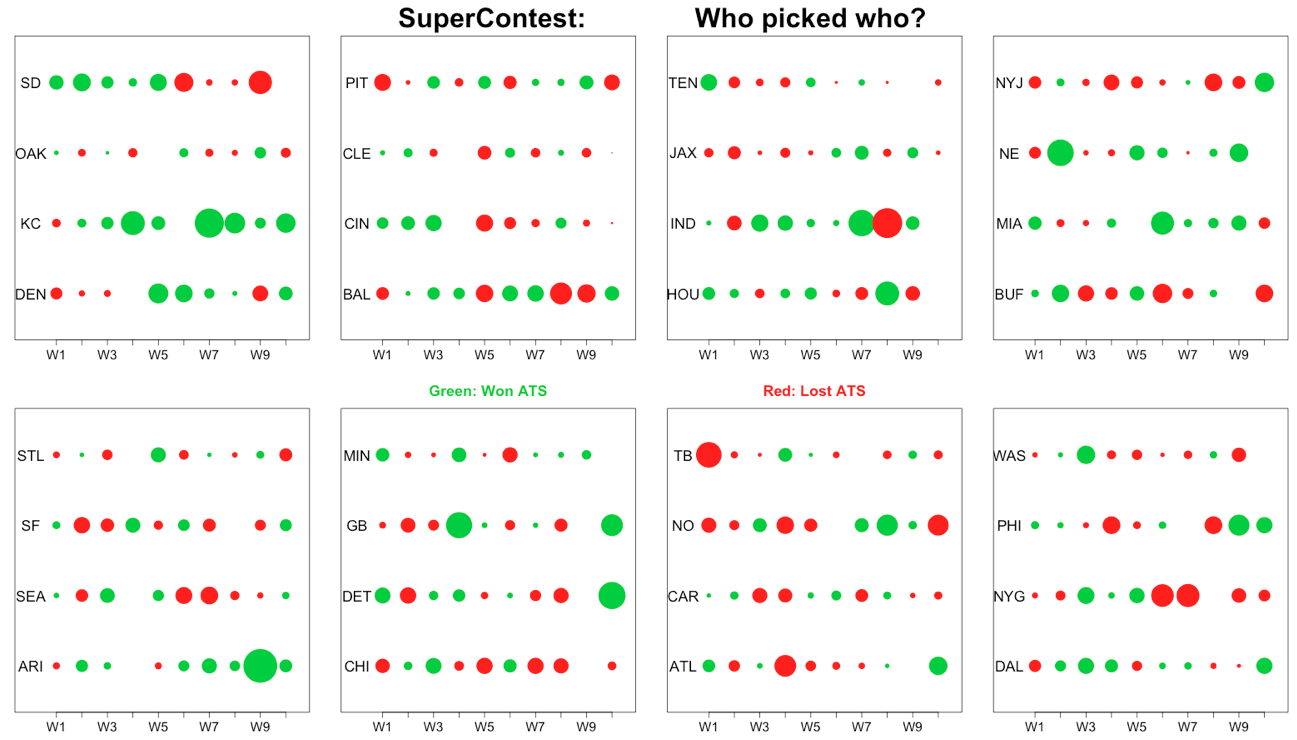
A few interesting aspects of the chart: (i) Kansas City is on a seven game win streak ATS, (ii) the number of bettors backing Arizona and Indianapolis has increased over the course of the season, and (iii) few bettors have liked St. Louis, Oakland, or Cleveland at any point thus far.
At some point, I might try to come up with a strategy to analyze a bettor belief hot-hand in this data set, but for now, I don’t see much of an obvious pattern with respect to sequential circle sizes.
2) Do bettors back teams off a bye-week?
To the best of my knowledge, the point spread given in the Westgate contest incorporates the possible advantage that teams coming off of a bye would have.
However, the size of circles in the figure above among teams playing after a bye week appears larger than the typical circle size (to look for bye weeks, look for the blank spaces).
To look at this idea, I isolated weeks 5 through 10, when teams were coming off of the bye week. Teams coming off of a bye week were picked, on average, by about 320 bettors. Teams not coming off of a bye week were picked, on average, by 240 bettors. That seems like a massive difference to me, particularly considering that the point spread, in principal, should incorporate the fact that teams are coming off of a bye week.
3) Are bettors consistent?
This is a question that I was really excite to look at – are the bettors who do well early in the year also the ones that do well later on? Here’s a plot of win percentages for each participant, splitting the season into two halves (Weeks 1-5, Weeks 6-10). Points are jittered to account for overlap in the scatter plot.
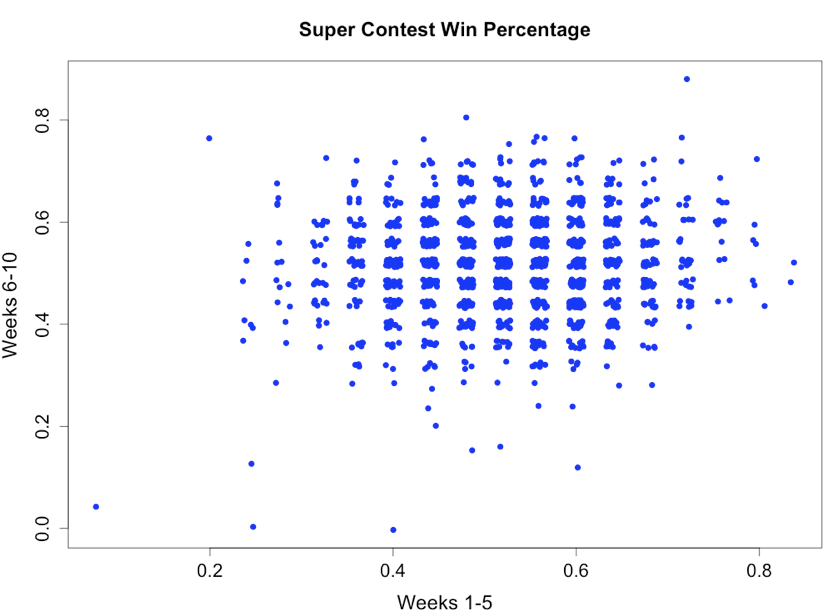
The correlation (0.07) is small but significant (p-value < 0.005), implying that there could be some level of underlying skill (or lack of skill) to picking these contests.
However, comparing all participants has two flaws. First, bettors that do poorly may change their strategy in an attempt to catch the players in front of them. Worse, bettors with a bad start might just give up; indeed, there are some participants who are no longer submitting picks.
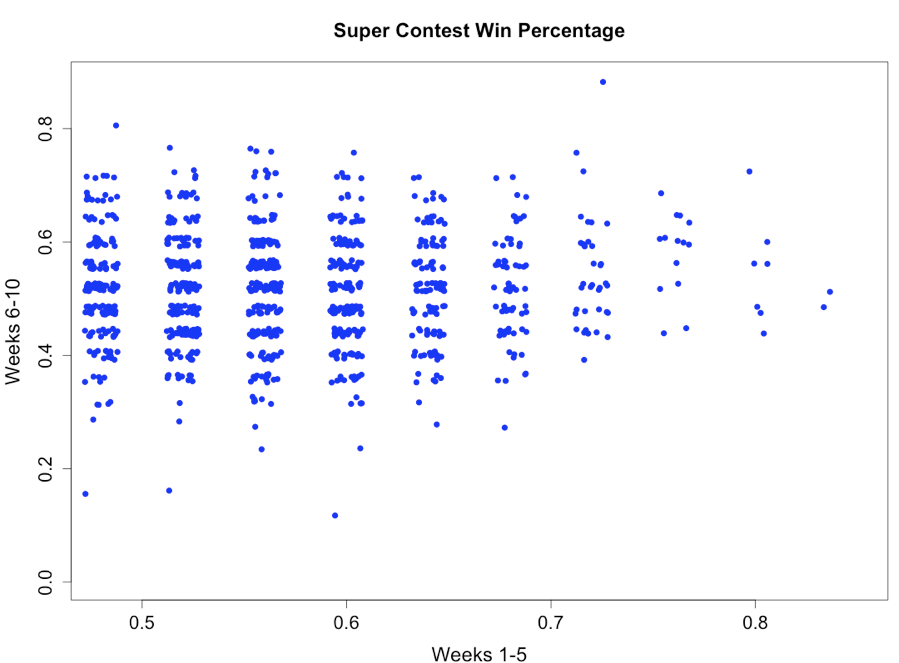
I looked at the same graph, isolating those participants who posted win percentages above 48% in the first five weeks. The correlation remains small (0.05), but it’s positive. Indeed, bettors that are superior in the early weeks could conceivably be superior in later weeks. That said, most of a bettors performance appears due to chance.
What’s next?
At some point, I want to try and look at the following ideas. Let me know if you can think of others:
Idea 1: Do bettors back teams playing in Sunday night and Monday night games more often than those in Sunday day games?
Idea 2: Do bettors back teams that they have had success backing before? In other words, if Mike picks the Patriots successfully three weeks in a row, is he more likely to pick the Patriots again?
What else should is there to know?
I did not enter the Super Contest this year (or any year, for that matter).
I did, however, enter a contest (purely for fun) with the same rules, run by affiliates of USC’s Jeremy Abramson. While the prize money won’t compare to the Super Contests’, I did get this email last week: “just remember that good teams are good and bad teams suck.”
Can’t put a price tag on that advice.
Finally, the data for the Super Contest isn’t perfect, with some participants changing their team’s name mid-season. This created a slight problem when looking at success levels over time. As a result, I cannot guarantee 100% accuracy regarding the correlations, although my quick cross-check suggested that most season picks matched the website’s standings.
