The decisive play of the 49ers-Ravens Super Bowl was a fourth-down pass to the end zone in which 49ers receiver Michael Crabtree – depending on your point of view – was or wasn’t interfered with. Had the officials called a penalty, the 49ers most surely would have won the game by scoring a touchdown with four plays from the goal-line. Instead, Baltimore took over, and essentially ran out the clock for the win.
A popular theory floated around after the game is that while there may have been sufficient contact on the 4th-down pass to Crabtree to warrant a flag, the officials did not make the decisive penalty call because the play occurred in the final moments of the game. In essence, this argument suggests that officiating crews should have less of an impact in the game’s final moments.
My interest was whether or not this is actually the case … Do NFL officials change the frequency of penalty calls over the course of the game? Specifically, I was interested in pass interference or defensive holding penalties, the likes of which could’ve been called at the conclusion of the Ravens-49ers Super Bowl. Are officials less likely to call these penalties in the waning moments of the game?
Using the website Advanced NFL Stats, I took a sample of nearly every play from the 2002 to 2012 NFL regular seasons (the site does not have a post-season database). The 2010 season, for some odd reason, was not available when I aggregated the data, and so that season is excluded from this analysis. In all, this yielded 386,827 total plays, of which 183,209 were planned offensive passing plays, defined as a play ending in an interception, a reception, an incompletion, a sack, or a pass interference/holding penalty. QB spikes were not included in this sample.
My outcome of interest is whether or not a pass interference call (or a defensive holding call) was called on each play over each minute of the game. I stratified each passing play by the half (First, Second) and game minute (1-60) in which the play occurred. Separating by half seemed important because strategy is often different at the end of the first half; it wouldn’t make sense to compare minute #30, the final minute of the first half, to minute #31, the first minute of the second half.
For each minute of play, I calculated the percentage of plays in that minute in which a pass interference or a defensive holding call was made. In all, pass interference calls occurred on 1.5% of the plays in my sample, with defensive holding calls occurring on 0.7% of plays. Lastly, I ran the analysis for both for all plays and only for plays in which the game was “Close.” I defined a game to be close as follows:
Quarters 1-3: Any game with a score differential of 21 points or less
First 10 minutes of Quarter 4: Any game with a score differential of 14 points or less
Final 5 minutes of Quarter 4: Any game with a score differential of 7 points or less.
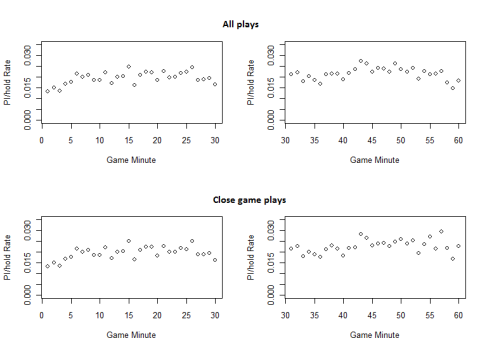
Below lies the plot for Pass Interference (PI) call rates. The graphs on top come from all plays in the data set, while the graphs below represent penalty rates from close game plays. The graphs on the left and right show first (Minutes 1-30) and second (Minutes 31-60) half plays, respectively. .
Here is the same plot, combining defensive holding calls and pass interference calls.
From the above two graphs, it is fairly clear that if the officials do swallow their whistles, the effect is fairly small. There appears to be a smaller chance of pass interference calls in the opening minutes of each half, but this is possibly due to a more conservative play-calling approach from the coaching staffs. A few more random points:
Random point #1: It seems as if there may be a higher likelihood of flags at the end of the first and third quarters, and a lower likelihood at the start of the second and fourth quarters. Do coaches get aggressive with their pass attempts before the teams switch sides? Of course, this could be due to chance, too.
Random point #2. Minute 59 seems to be the only evidence of a lower Pass Interference (PI) rate towards the end of games. Minute 60, meanwhile, falls right in line with the rest of the trend. For what its worth, the penalty rate difference between minute 59 and minute 58 is roughly 1 call in 250 passing plays. Based on the number of total plays in these minute intervals, this rate difference equates to about 3 penalties per year.
Random point #3: I thought the frequency of calls, by season, was fairly interesting – Higher, lower, and then now higher again
Season Hold/PI rate
2002 0.023
2003 0.025
2004 0.024
2005 0.026
2006 0.020
2007 0.016
2008 0.020
2009 0.020
2011 0.023
2012 0.027
Random point #4. I was also interested in offensive holding calls, since, of course, linemen never get any credit! I looked at any offensive play (excluding punts, kneel-downs, QB spikes), and used the same criteria as above. With holding calls, there DOES appear to be a tendency to make fewer calls at the end of each half, relative to the plays made earlier.
Conclusion: For a more concrete statistical analysis, I’d want to model penalty likelihood as a function of play call, down & distance, score differential, and probably a few more variables. For now, this set of time series graphs suggests that if NFL officials are swallowing their whistles in the closing moments of a game, they are doing it more with respect to offensive holding penalties than defensive pass interference/defensive holding penalties.


