
There’s been some excellent work done on field goal kickers, but I figured that in preparation for Sunday’s game between Minnesota and Seattle, it’d be worth a look at the link between kicking success and game temperature. For related work, see Brian’s post here.
Using awesome data from Armchair Analysis, I grabbed all field goal attempts from 2000-2014. Via the mgcv package in R, I fit a generalized additive model of field goal success (Yes/No) as a function of three unknown smoothed functions – one apiece for distance, wind speed, and temperature – and a single fixed effect, for the season. See the footnotes for more details and the code.
Here’s a plot of estimated success rate, by temperature, for a fixed field goal distance of 33-yards (this distance is the current extra point) and assuming a wind of 15 mph. In Sunday’s game, the temperature is expected to be 0 degrees.
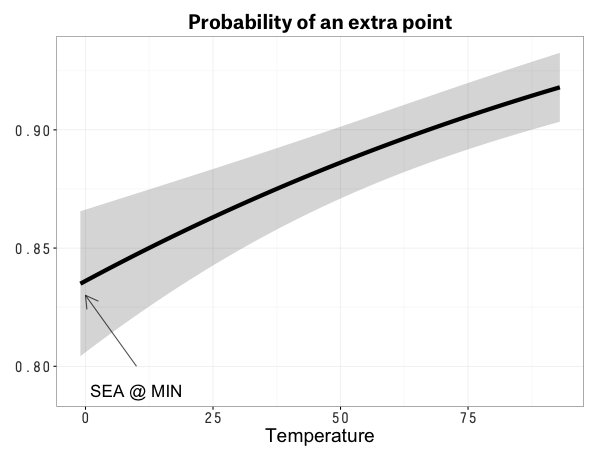
The plot suggests that even with normal weather, the anticipated wind speed in Minnesota is enough to drop extra point rates from the usual success rate of 95% to about 90%. Add in the 0-degree temperature, and my model’s best guess at the success rate of an extra point lies between 80% and 85%.
Does this mean anything?
Maybe. At about 83%, it’s just as likely than as not that if the game has four touchdowns, kickers will be perfect. But it’s something to look out for if the game comes down to even the easiest of kicks.
******************************************
Next, to compare across kicks of different distances, I fixed wind speed and looked at the predicted probabilities of successful 30, 40, and 50-yard field goal attempts.
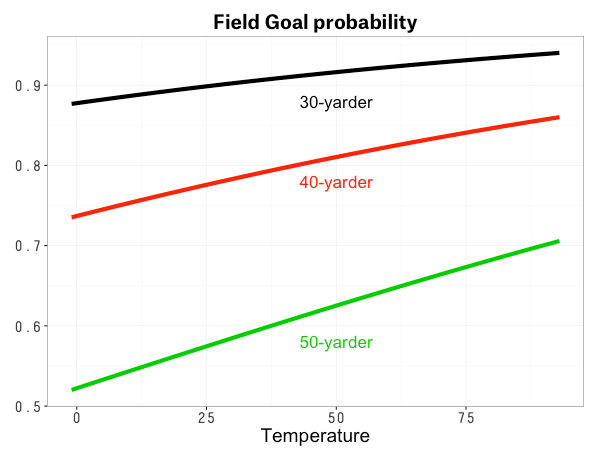
The plot makes it evident that cold temperatures have the biggest effect on kicks of longer distances. The absolute drop from 70% to 50% with 50-yard FGs is gigantic, relative to a drop from 94% to 89% for 30-yard FGs.
In fact, one could argue that the change in field position is severe enough on long-distance field goals that they should be avoided all together in Minnesota on Sunday.
*********************
Finally, here are a pair of contour plots. To account for wind and temperature, I created a new variable, windchill.
First, a plot with lines showing the probability by distance and windchill.
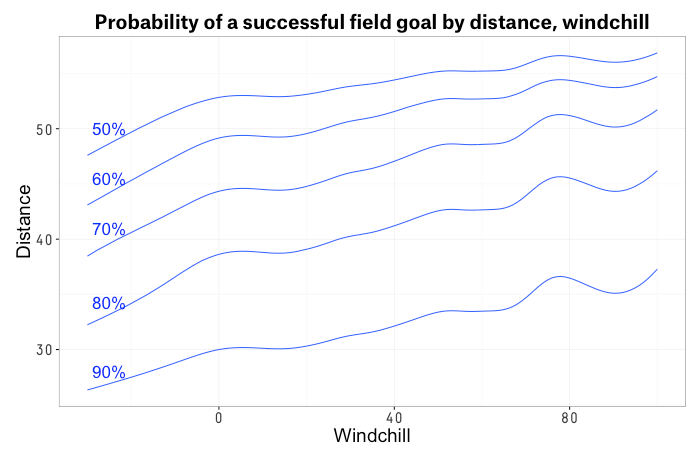
According to the plot above, a 40-yard field goal with a 25-below windchill (as is anticipated in Minnesota) is roughly the same probability as a 50-yarder in warmer weather. By and large, a windchill of -25 degrees appears to cost kickers 10 yards.
Second, here’s a heat map. The density of red reflects the distances and the temperature in which it is difficult to kick field goals.
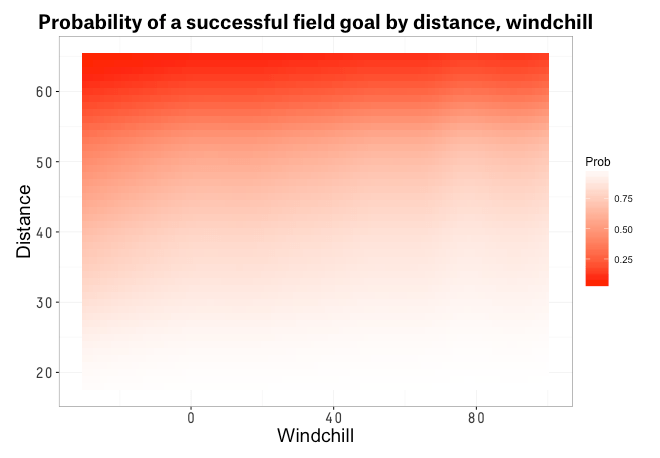
Same idea. Kickers are near automatic in the white area, but things are a bit spottier in the red. And there’s a whole bunch more red when its cold out.
*********************
Notes on the method:
Generalized additive models are attractive with these (and many other) types of continuous explanatory variables because they don’t make assumptions about the functional form between say, temperature and field goal success. Thus, I don’t have to assume what my relationship is and then check it with other model fits. Further, by using cross-validation, I don’t worry about over-fitting. Note that the fixed effect for season ties into Ben Morris’ awesome work showing that kickers have gotten better.
Here’s the code on Github.
