
When the NHL changed its point system (PS) after each of the 1999 and 2004 seasons, initially adding a point for overtime losses and then the shootout at the end of tied overtime games, economists jumped at the chance to measure how teams varied their behavior in response to the incentives encouraged by league policies.
We can be assured in one thing, which is that overtime rates went up when the newest point system was implemented. Teams reaching OT now share three points, with two going to the winner and one to the loser. Because only two points are awarded in regulation, the larger share of points for OT participants encourages teams to play for regulation ties, as to guarantee themselves a point. Empirical evidence (see Abrevaya) and theoretical justification (see Longley & Sankaran) has shown that in most tied-game situations, NHL teams should be playing for overtime.
However, while game outcomes have been contrasted extensively, one aspect that has been lacking in research is empirical evidence showing how the behavior of NHL teams varies. In an article today at FiveThirtyEight, Noah Davis and I try to do just that, helping to show how, where, and when NHL teams appear to vary their on-ice behavior in accordance with the league’s current and past PS’s.
Using expected goal rates, we first show that in the final 5 minutes of tied regulation games, NHL teams play passively, as judged by lower expected goal rates. This difference is exaggerated when comparing to behavior at the end of the first and second periods, and to the teams’ behavior when the game is not tied.
Next, comparing two of the league’s PS’s, we show how the rates of overtime in the current PS go up at the end of the season, when the postseason push becomes of primary of importance, and teams look to guarantee themselves a point.
Enjoy!
Of course if you are interested in this stuff, keep reading 🙂
******************************
One figure left out of the article on FiveThirtyEight compares the behavior of teams in conference and non-conference games. Given that overtime incentives vary based on their opponent (see the quote in our article from the coach of the Washington Capitals), we wanted to compare the behavior of teams by game type. We chose conference and nonconference games, because for most of the past decade, postseason eligibility was judged within a teams’ conference.
Here’s our graph. The red band depicts the 95% confidence interval for expected goal rate during nonconference games, while the black band represents conference games. Nonconference games, by and large, feature lower EG totals during moments in which the game is tied, relative to conference ones, from late in the first period through the remainder of the game.
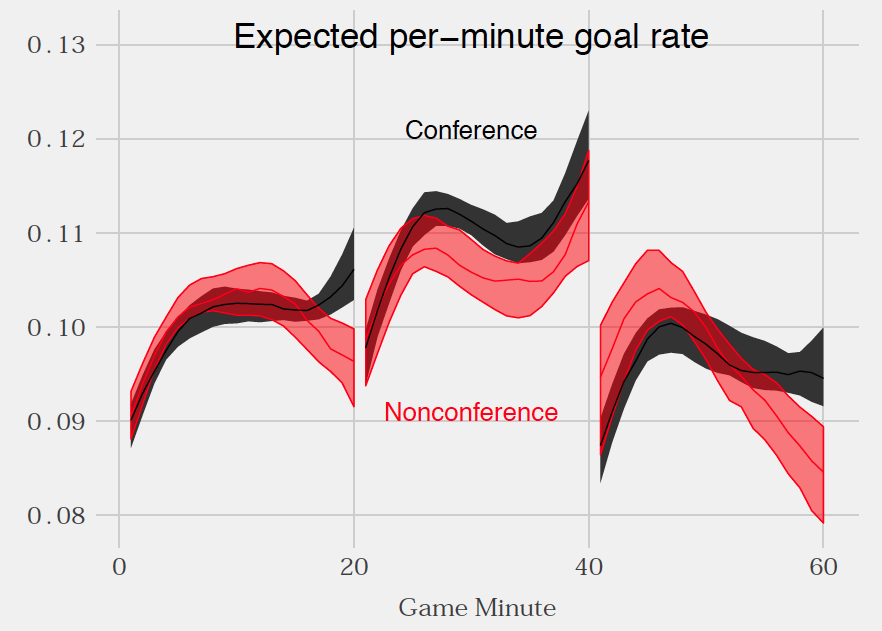
The widths of the confidence bands are important; while nonconference behavior tends to be more passive throughout the entirety of the second period, at the end of the third period, the EG rates drop to significantly lower levels among non-conference games. Note: Because the distribution of EG rate is unknown (or it would require making some strong assumptions), the calculation of confidence limits for the smoothed lines took additional care. I used bootstrap resampling of the observed data, fitting smoothed lines to each of the resampled data. The limits shown reflect the 2.5th and 97.5th percentiles of the smoothed lines at each game minute. Also, given that non-conference games are generally clustered in earlier portions of the season, this figure only looks at games played during the first half of each season, and we excluded the lockout-shortened 2013 season that featured conference games only.
In nonconference games, it appears teams have taken a more passive approach.
******************************
I am greatly indebted to war-on-ice for its data, and to Carnegie Mellon’s Sam Ventura for his work with expected goals (Sam specifically shared his code with me, but credit also goes to folks who started with work on expected goals).
In that spirit, I wanted to share the code I used to replicate the Figures for FiveThirtyEight. These can be found on my new GitHub page. (Yes, it is a bit embarrassing that I am new to Github. For several years, I have just posted useful code at the end of blog posts. However, I figured it was time the code moved to a more traditional resource).
Figure 1 will require you to have downloaded all of the play-by-play data from the nhlscrapr package in R. This data can take overnight to download, and again overnight to run the for loop to extract game behavior based on each game minute and situation. So, perhaps for the intermediate or veteran coders only.
Figure 2 is straight-forward and should work in less than 2 minutes for anyone with an internet connection.
Cheers, and thanks for reading!
***************************************
