
As of yesterday, Buster Posey, Jacoby Ellsbury, and Ryan Howard were each ranked between 90th and 100th in OPS among all MLB baseball players. That threesome is making $58 million in 2014 alone, with a whopping $338 million owed to them by their teams after this season ends.
Such a trifecta of seemingly awful contracts got me thinking about team performance in the post steroid era. Bad & expensive contracts have always been a part of sports, in particular baseball, but with performance perhaps more variable now than in prior era’s, are general managers with cash to spend having a more difficult time doing so?
Here’s a graph of team payroll and win percentages for each team in the 2004, 2009, and 2014 seasons.
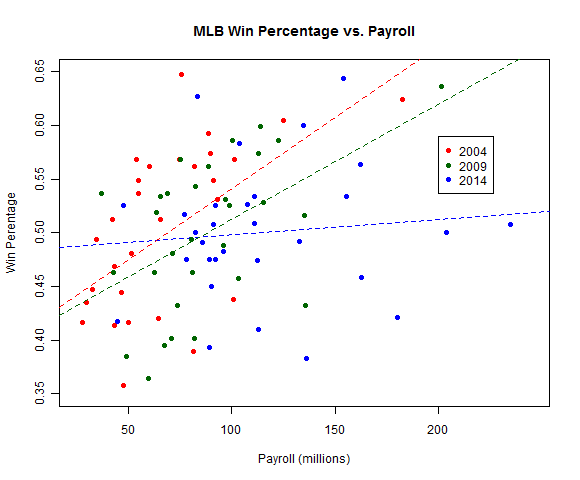
Teams spending money in 2004 posted much higher win percentages, on average, than frugal teams. This association was weaker in 2009, and there is hardly any relationship through the first portion of the 2014 season between payroll and team performance.
Obviously, there are several factors at play, beyond baseball transitioning past the steroid era. First and foremost, we are only about 40% of the way through the 2014 season, and by season’s end, this graph might look different. Second, independent of steroid testing, it could be that general managers with large payrolls have gotten worse, while those behind teams with lower payrolls are making sounder decisions.
That said, it appears as if small market teams have more reason for optimism today than they did a decade ago.
As a final note, trend lines can be driven by extreme points. Here’s what the graph looks like with the Yankees removed.

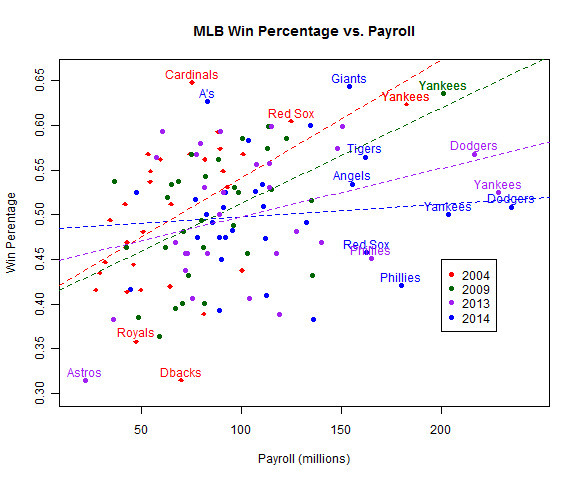
PS- Someone requested that I label the teams on the graph

PPS – Let’s include 2013.

Reblogged this on Stats in the Wild.