
I don’t know, but its bad.
Here’s a graph of the 2014 total run differentials, by division, compared to scaled results from 2013 (to reflect roughly a quarter of the season being played).
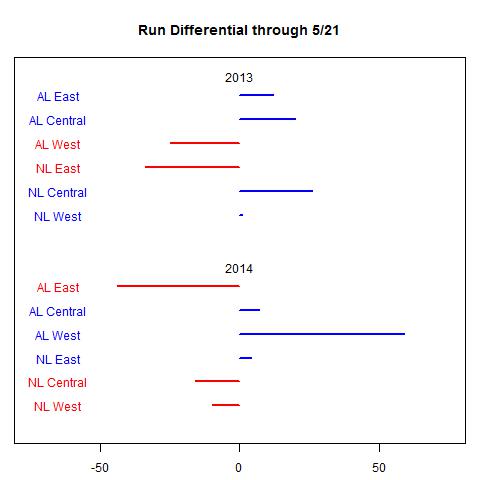
The AL East and NL Central have gone two of baseball’s best divisions to its two worst (based on run differential).
The AL West (admittedly led by Oakland’s +98) blows remaining teams out of the water.
I don’t know enough about baseball to know why this has happened, and its important to point out that some of these results could be due to the relatively smaller number of games played through 2014. Run differentials numbers are useful, but can vary over the course of the season.
Still, its a surprise for the AL East, which was supposed to be ‘loaded again‘ and a ‘stacked division.’
