
A few days ago, I posted on momentum in hockey, finding that, on average and in tie games, a streak of goals is not a great predictor of future goals.
While I had mostly put the issue to bed, a few tweets peaked my interest last night. Specifically, it had been pointed out that teams forcing OT in the waning minutes of regulation were on a nice hot streak when it came to winning in the extra session.
I figured with the ease of extracting NHL play-by-play data, it might be possible to check this idea over a larger sample of games.
Here’s a quick walk through, using the nhlscrapr package in R.
**Scroll down if you don’t care about the coding**
First, let’s start with a few data entry things. The data set grand.data contains all NHL play-by-play data as of 2002 (up to a few weeks ago, so I am ignoring the games mentioned above). I extract only goal scoring plays, and give each of these events a game and season indicator (more on these later). Also, I’m not interested in 0-0 games that reach OT, because no team will have scored an equalizer to force OT, and so I get rid of those events, by isolating goals that were scored in non-scoreless games.
set.goal <- grand.data[grand.data$etype == "GOAL",]
set.goal$GameSeason<-paste(set.goal$gcode,set.goal$season,sep="")
set.goal$OT<-set.goal$seconds>3600
set.goal2<-set.goal[set.goal$home.score+set.goal$away.score>=1,]
Next, I need to identify the last goal scored in regulation, when it was scored, and whether or not that team was the eventual winner in OT.
Let’s start with identifying OT goals, where I eliminate goals scored in the shootout (entered at second 4800).
set.OT<-set.goal2[set.goal2$OT=="TRUE"&set.goal2$seconds!=4800,]
Next, we find the last goal scored in regulation of each game. To start, I identify only regulation goals, entered into the data frame set.reg. Next, I rely on the R entry do.call, which nicely extracts the maximum (or any function) of a data set, by each game (as referenced by set.reg$GameSeason). Here, I’m identifying the goal in each game which was scored closest to the end of regulation.
set.reg<-set.goal2[set.goal2$OT=="FALSE",]
set.reg2 <- do.call("rbind", by(set.reg, set.reg$GameSeason, function(x) x[which.max(x$seconds), ]))
rownames(set.reg2)<-1:nrow(set.reg2)
At this point, set.reg2 contains only the last goals scored in regulation of each NHL game.
Next, we are only interested in the final goal scored in regulation if that goal forced a game which was eventually decided in OT. Here’s another time where we need our game indicator, GameSeason. This line of code reduces a much larger data set (set.reg2) to one showing only games eventually decided with an OT goal.
set.reg3<-set.reg2[set.reg2$GameSeason%in%set.OT$GameSeason,]
At this point, we have two data frames, set.reg3 and set.OT – setreg3 contains the final regulation goal of games ending regulation tied, among the 1,461 games eventually decided in OT (and not a shootout), while set.OT has the eventual winning goals.
Now, the fun part, as we merge the two data sets (set.reg3 and set.OT), and isolate whether or not the goals (event.x, and event.y) were scored by the same team.
set.all<-merge(set.reg3,set.OT,by.x="GameSeason",by.y="GameSeason")
set.all$sameteam<-set.all$ev.team.x==set.all$ev.team.y
> mean(set.all$sameteam)
[1] 0.5023956
**Results here**
Thus, using all games eventually decided in OT since 2002, 50.2% were won by the team which scored the equalizer.
The question posed using the tweet the beginning of the blog, however, was whether or not equalizers scored just before the end of regulation were associated with OT win likelihood. This has been asked before, most notably at the end of this column by Grantland’s Bill Barnwell. Here, I’ll briefly expand.
First, let’s find the game minute in which OT equalizers were scored.
set.all$GameMinute<-floor(set.all$seconds.x/60+1)
The median equalizer was scored in the 53rd minute of action, with 14% of all equalizers scored in the final minute of play (again, we’ve excluded scoreless games from this study).
Lastly, here’s a plot of OT win likelihood by equalizer minute. In general, the R package ggplot2 makes for better graphs, but I put this together right after the Bruins lost night, where I was prioritizing speed over perfection, and I just used basic R commands.
par(mar=c(4,4,2,1))
agg<-aggregate(sameteam~GameMinute,data=set.all,FUN="mean")
plot(agg[,1],agg[,2],xlim=c(40,60),ylim=c(0.2,0.8),ylab="OT win probability"
 ,xlab="Game minute of equalizer",pch=16)
abline(h=.5,lty=2,col="red")
text(50,0.75,"Team scoring equalizer wins in OT",col="red")
text(50,0.25,"Team scoring equalizer loses in OT",col="red")
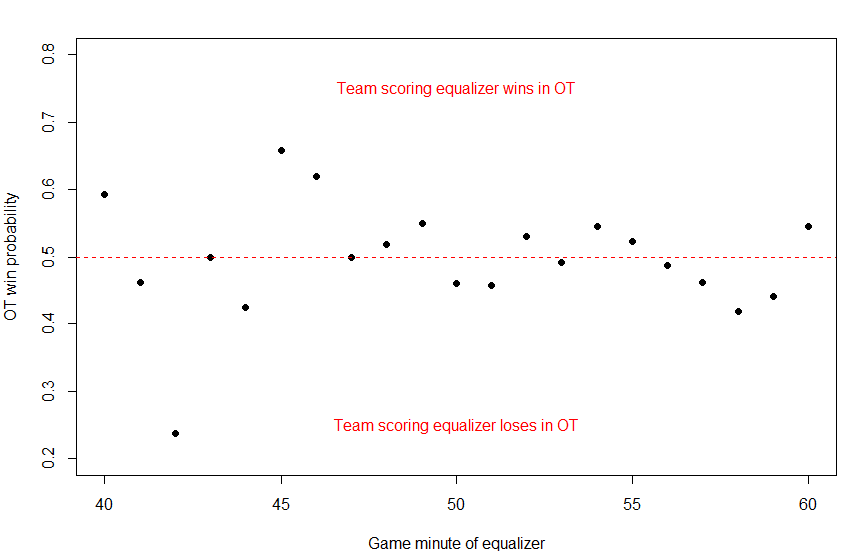
On the whole, there appears to be little association between the equalizing time of the final goal and whether or not that goal eventually translated into overtime success. While 54.5% of the teams forcing OT in the final minute of play eventually won the game, only 44% of those forcing OT in minute 59 won the game, so I’m hesitant to read too much into the final data point of this graph.
Also, you’ve probably realized that the left side of the graph is substantially nosier – OT win likelihood will fluctuate more in smaller samples, and the number of games tied in minutes 40-45 – which have to reach OT at that same score to be included in this sample – is much smaller than the number of games with equalizing goals scored in the final five minutes.
A few caveats.
First, I eliminated games decided in a shootout (regular season only). I suppose there’s a chance that momentum could carry over into shootouts, but that seems like a stretch, especially given that shootout outcomes, while not completely random, appear mostly due to chance.
Second, I’d prefer to measure outcomes like shots instead of goals, as shots may be more indicative of ‘momentum’ than which team scored the game-tying goal. That’s definitely an area for more research, and I’d love for someone to take the lead on that (you can use the code above to start!). One critical problem with measuring shots in OT is that the time-lengths of the extra session will vary by game. In this regard, a shot-rate outcome might be preferred.
Lastly, for fun, here are some of my favorite momentum tweets from last night. The first and last ones are my favorites.
https://twitter.com/hanley_james91/status/462043231652679681
https://twitter.com/MichaelDAmore2/status/462052999050059776
https://twitter.com/sbutton34/status/462071676919115777

One thing that could explain the outlying final data point could be the high percentage of teams that scored that goal with an empty net/extra attacker. It lowers the relative quality of OT-bound teams compared to the first 59 minutes when play is either 5v5 or earned/deserved powerplays/penalty kills. Perhaps omitting goals when teams have an empty net and extra attacker would yield results closer to 50%
That might be the case. I don’t think many equalizing goals are scored in the final minutes of play without an empty net (especially the last minute).
You could also argue it both ways with respect to team quality: the better teams might have been the ones to have the lead to begin with, or they might be more likely to tie the game up after facing a deficit.