
One of my passions is the use of statistics with data from sports. Over the last few years, several sites have been developed to use statistics to predict the outcome of sporting events. While several are private and cost money, there are a few that release their picks, or give them to espn.com, for public consumption. Four sites I followed for the NCAA Division 1 football season are teamrankings, Accuscore, Brian Fremeau’s BCF Toys, and numberfire. There are more sites out there, but its difficult to follow them all!
For the bowl games beginning with 12/31, I compiled a tally of how each site’s predictions fared versus the spread. The tally’s are too small to take too much from with regard to the long term accuracy of any method, but they do highlight the variability that comes along with this type of task. I was surprised at how some sites could do so well yet others do so poorly.
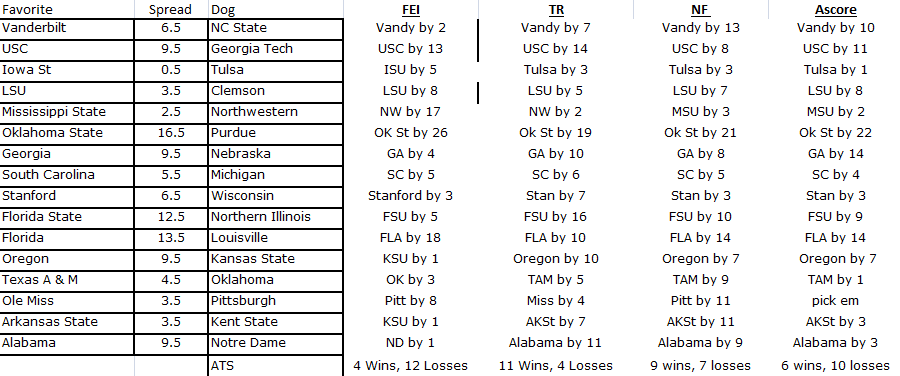
Site (Wins-Losses-Ties)
TeamRankings.com: 11-4-1
Numberfire.com: 9-7
Accuscore 6-10 (started 6-3, finished 0-7)
BCF Toys: 4-12.
Consensus: 7-7 (two games were split between the four sites)
A couple quick caveats. First, I used the point spreads taken from late December, which may not reflect the point spread on the day of the game. Second, BCF Toys presents a couple prediction models – I looked at the one here.
I included a picture of the predictions here. I did some rounding, but the main idea, and outcomes, should be fairly accurate.

1 Comment